Updated about 12 years ago by Mayer Michael
GModelSpectralLogParabola
This class allows a spectrum definition with an energy-dependent index. It follows the formula:
: Normalisation at reference energy
: Index at reference energy
: Curvature
: Pivot energy (reference energy)
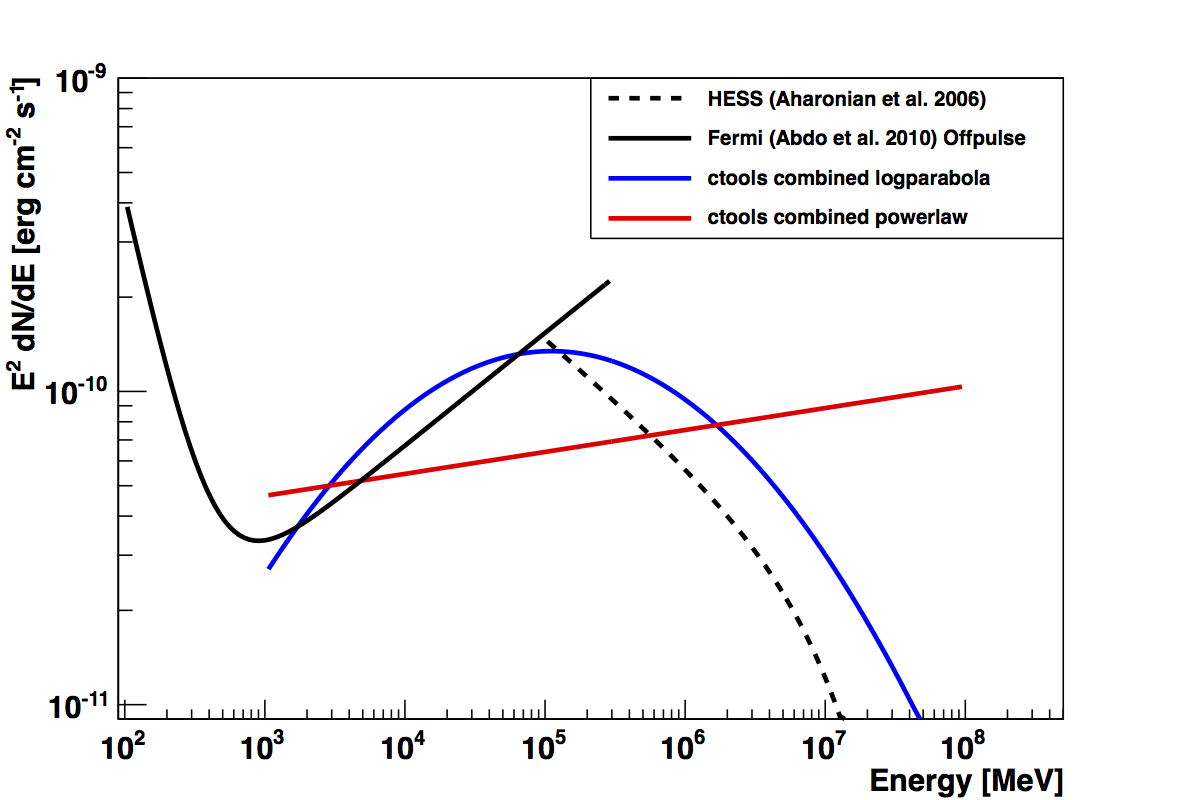
A first test of applying this model to real data from Fermi LAT and HESS is attached.
ScienceTools implementation
Below the code that is implemented in the Fermi-LAT ScienceTools. Note that the index and curvature are defined as positive values here, as the negative sign is explicitely implemented in the formula.
double LogParabola::value(optimizers::Arg & xarg) const {
   ::Pars pars(m_parameter);

   double energy = dynamic_cast<optimizers::dArg &>(xarg).getValue();
   double x = energy/pars[3];
   double my_value = pars[0]*std::pow(x, -(pars[1] + pars[2]*std::log(x)));
   return my_value;
}

double LogParabola::derivByParam(optimizers::Arg & xarg,
                                 const std::string & paramName) const {
   ::Pars pars(m_parameter);

   double energy = dynamic_cast<optimizers::dArg &>(xarg).getValue();
   double x = energy/pars[3];
   double logx = std::log(x);
   double dfdnorm = std::pow(x, -(pars[1] + pars[2]*logx));

   int iparam = -1;
   for (unsigned int i = 0; i < pars.size(); i++) {
      if (paramName == pars(i).getName()) {
         iparam = i;
      }
   }

   if (iparam == -1) {
      throw optimizers::ParameterNotFound(paramName, getName(),
                                          "LogParabola::derivByParam");
   }

   enum ParamTypes {norm, alpha, beta, Eb};
   switch (iparam) {
   case norm:
      return dfdnorm*m_parameter[norm].getScale();
   case alpha:
      return -pars[0]*logx*dfdnorm*m_parameter[alpha].getScale();
   case beta:
      return -pars[0]*logx*logx*dfdnorm*m_parameter[beta].getScale();
   case Eb:
      return value(xarg)/pars[3]*(pars[1] + 2.*pars[2]*logx)
         *m_parameter[Eb].getScale();
   default:
      break;
   }
   return 0;
}
Monte Carlo Method
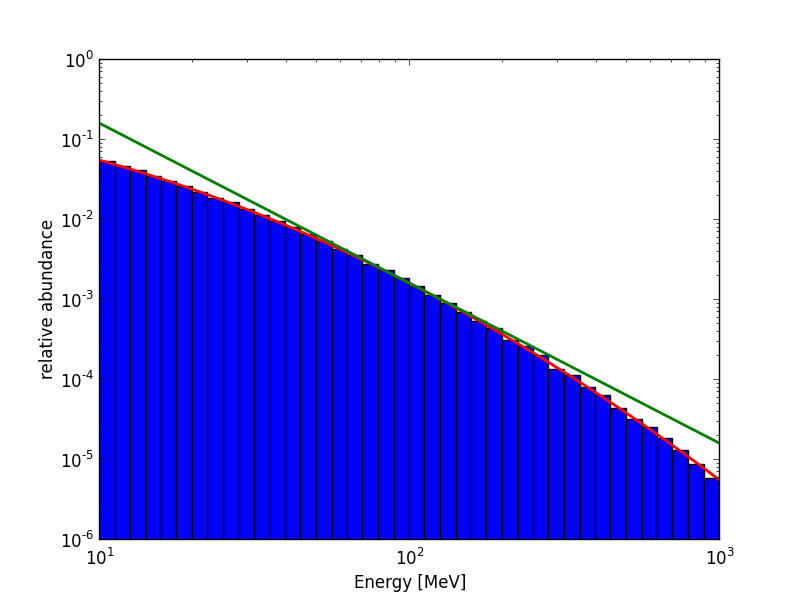
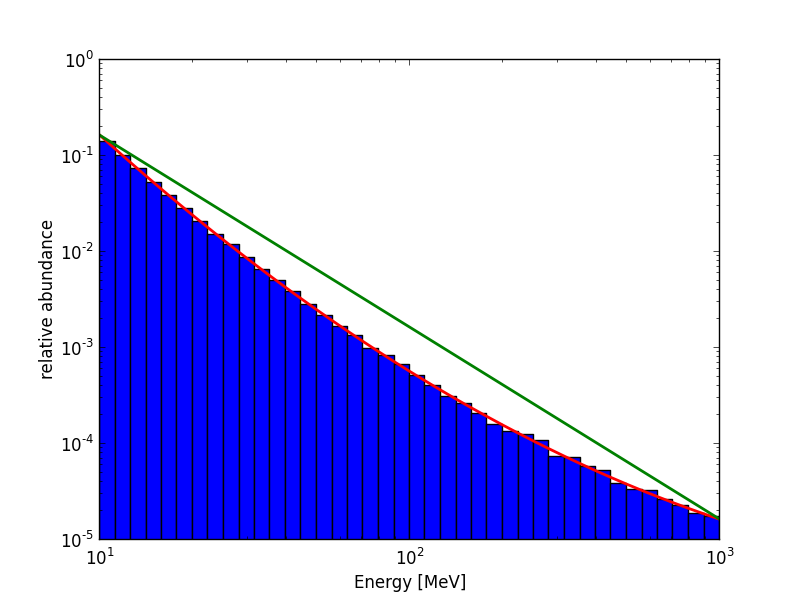
the method GModelSpectralLogParabola::mc(GEnergy emin, GEnergy emax, GRan ran) returns a random energy following the LogParabola distribution. The following plots have been produced using normalised LogParabola with the Parameters index=-2, curvature=+-0.2 and E0=100MeV. 100000 Events have been simulated. Red lines show the underlying LogParabola model while green lines correspond to the respective powerlaws which are used as function for the "rejection sampling method". 

{{fnlist}}


