 Knödlseder Jürgen
Updated over 8 years ago by
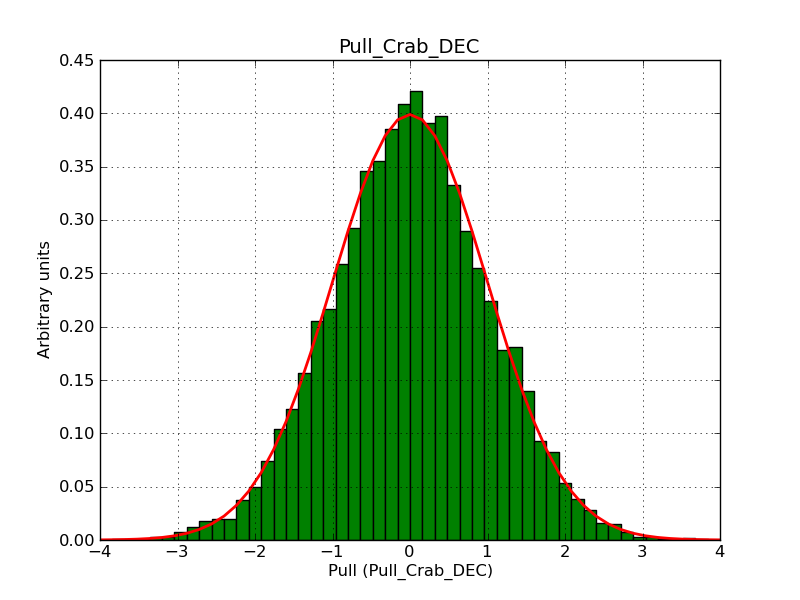
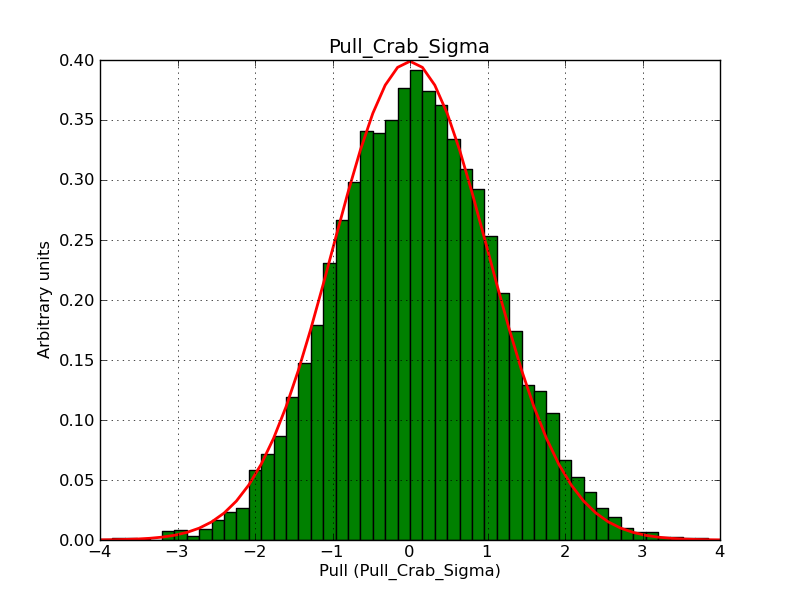
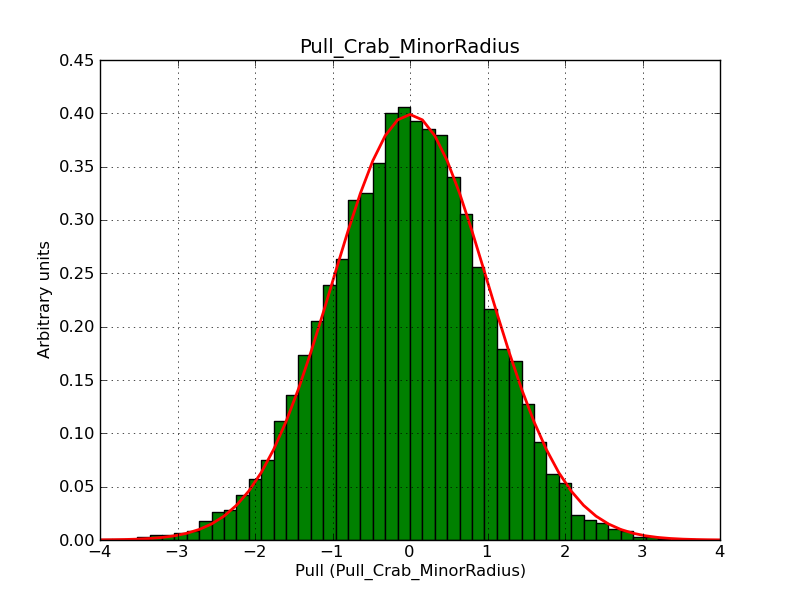
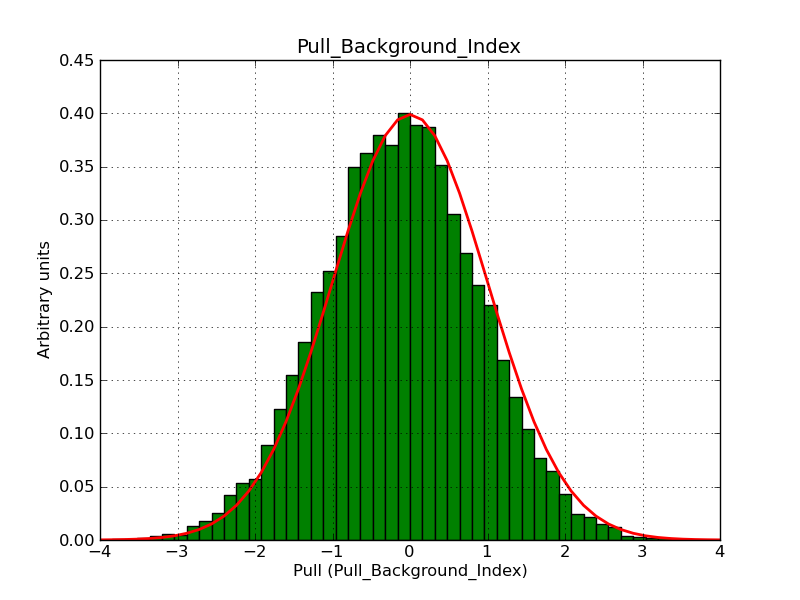
The following plots summarize the pull distributions for the spatial models obtained using an unbinned analysis.
| Point source |  |
 |
|||
| Disk |  |
 |
 |
||
| Gaussian | 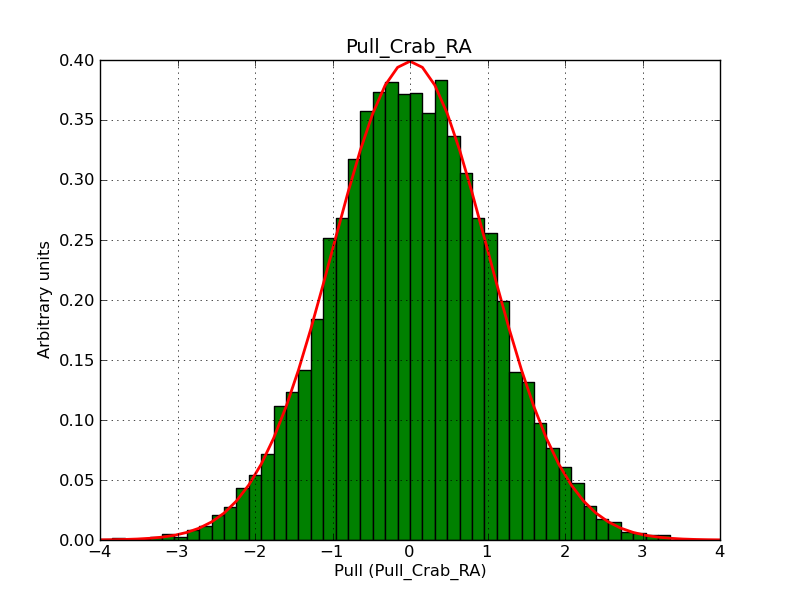 |
 |
 |
||
| Shell | |||||
| Elliptical Disk | 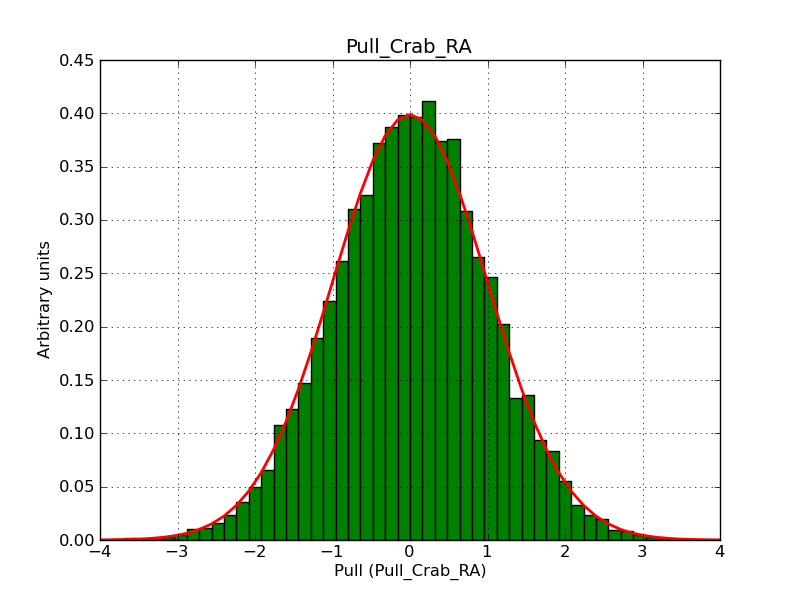 |
 |
 |
 |
 |
| Elliptical Gaussian |
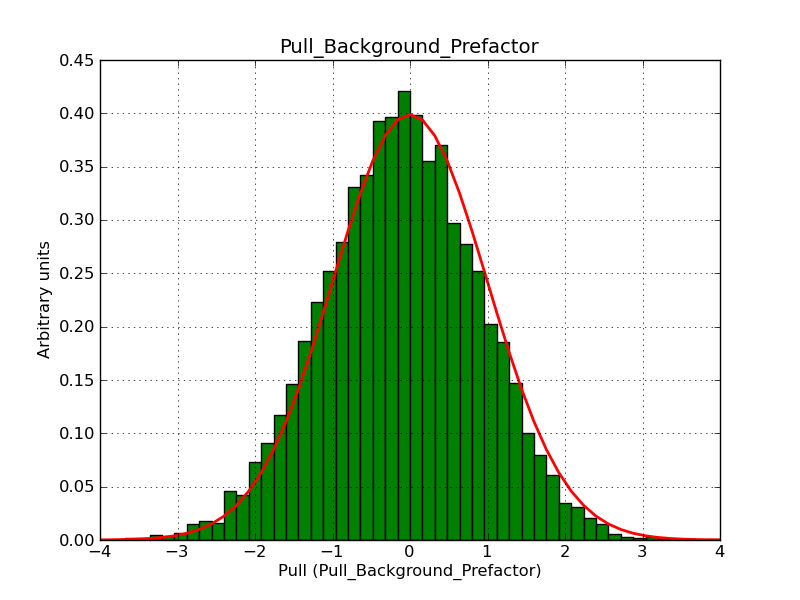
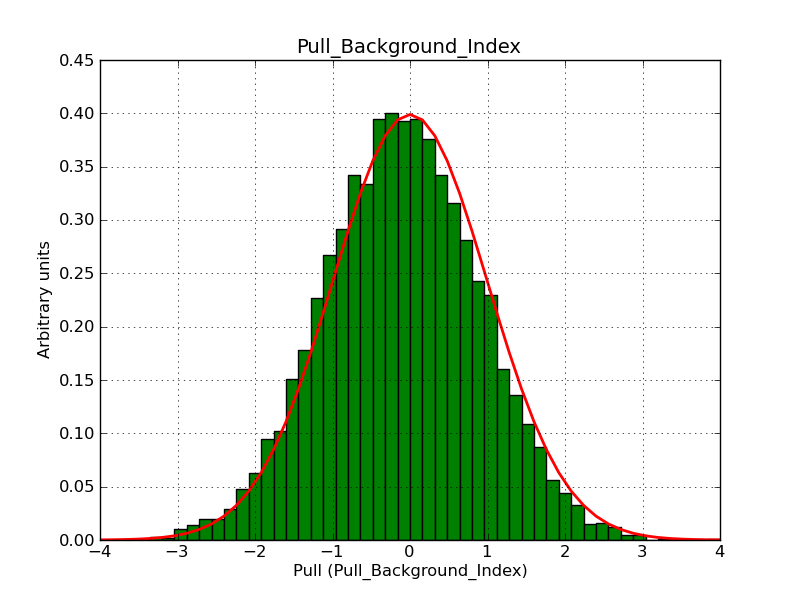
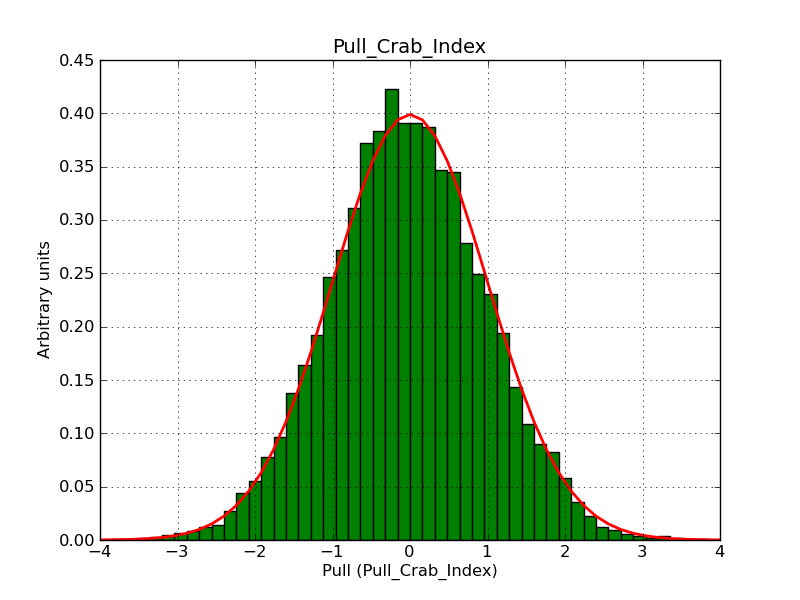
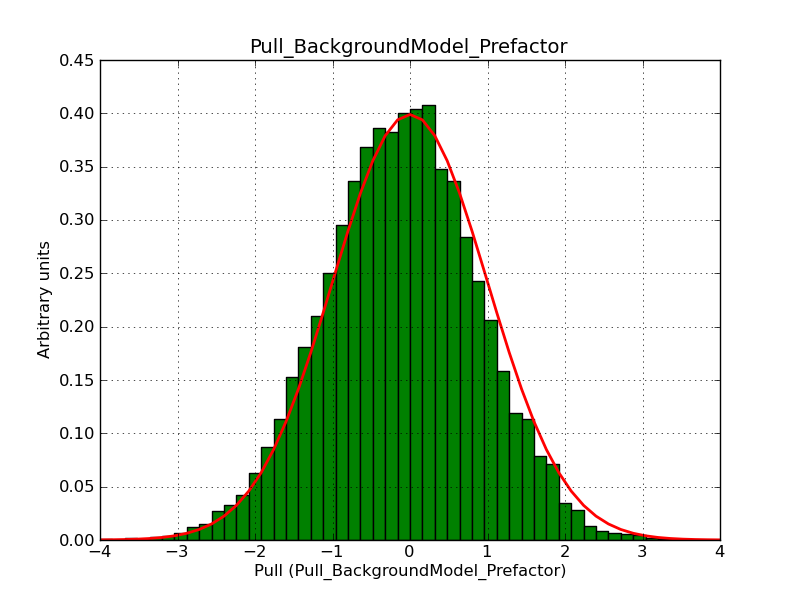
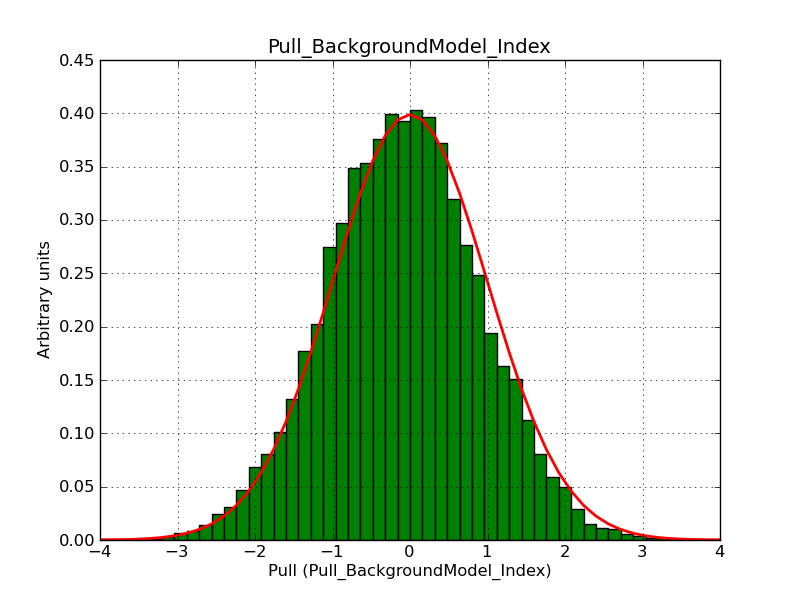
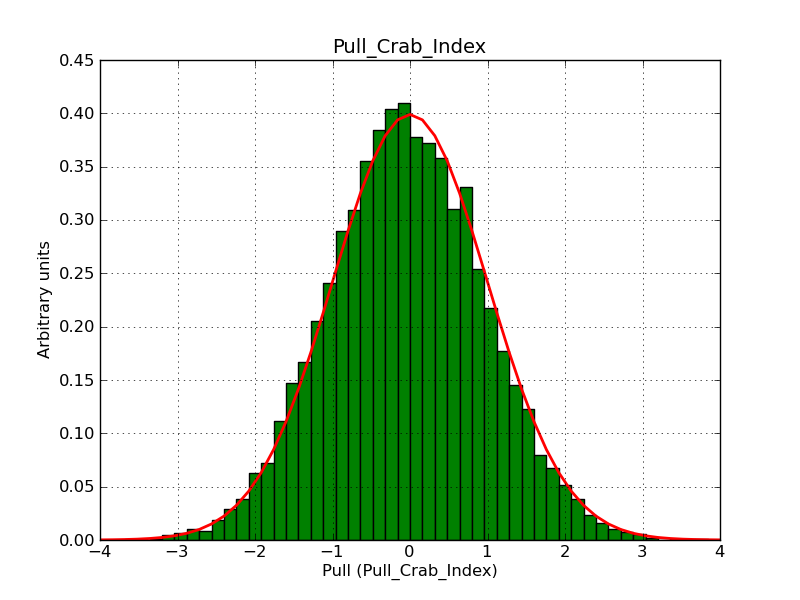
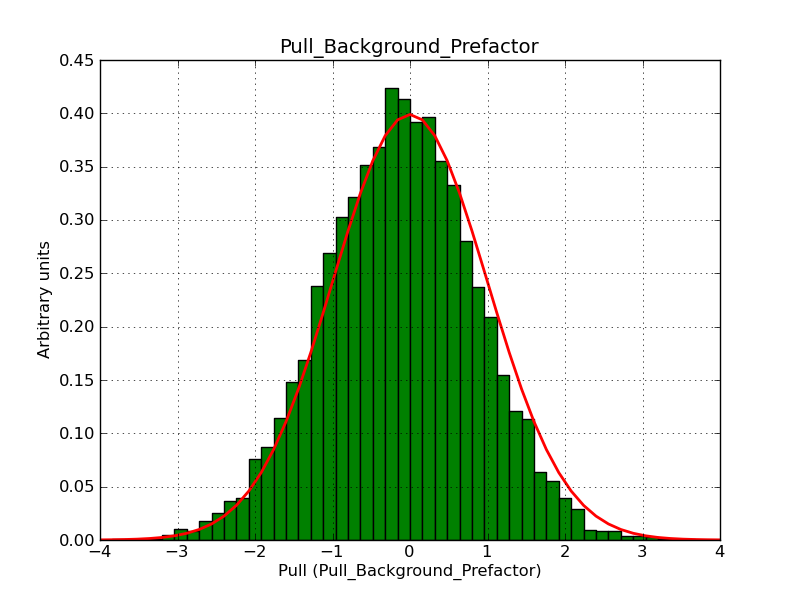
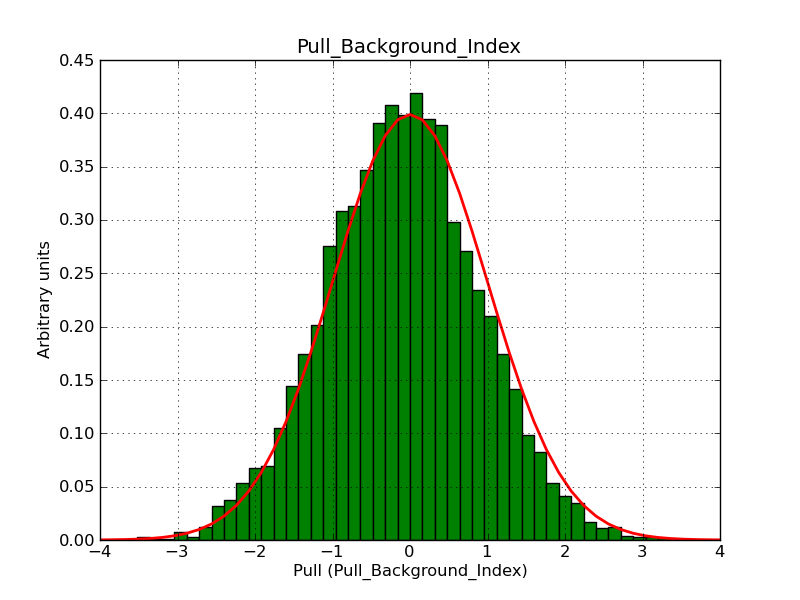
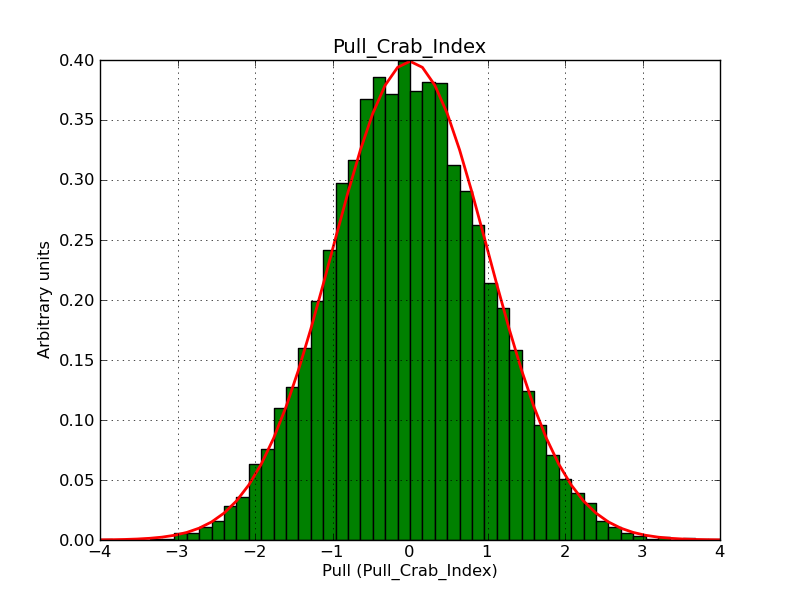
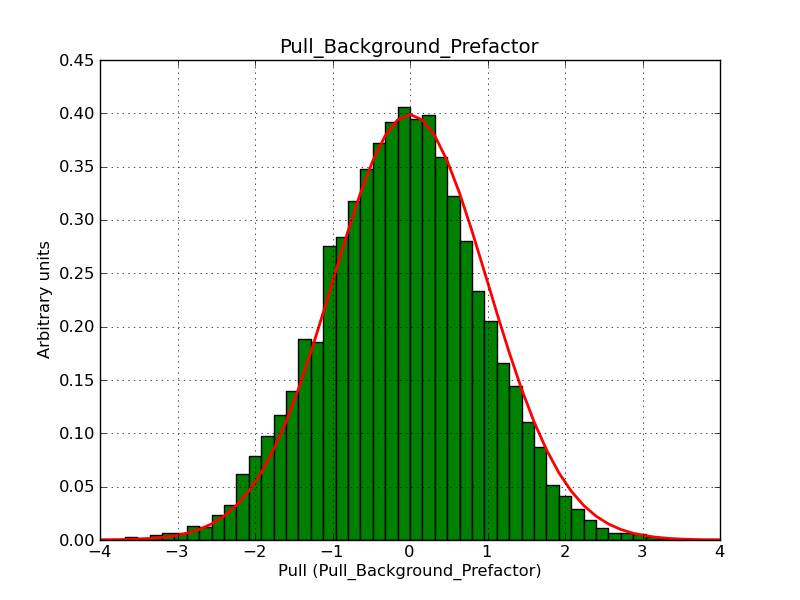
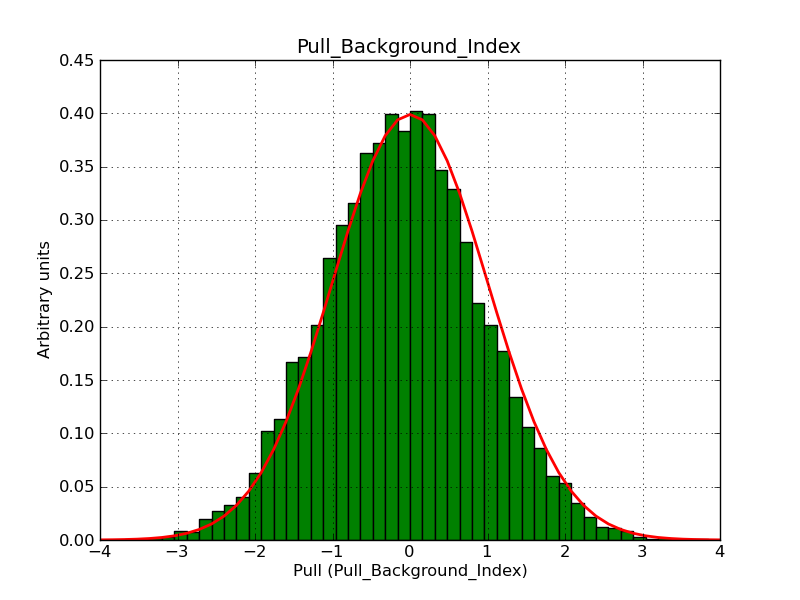
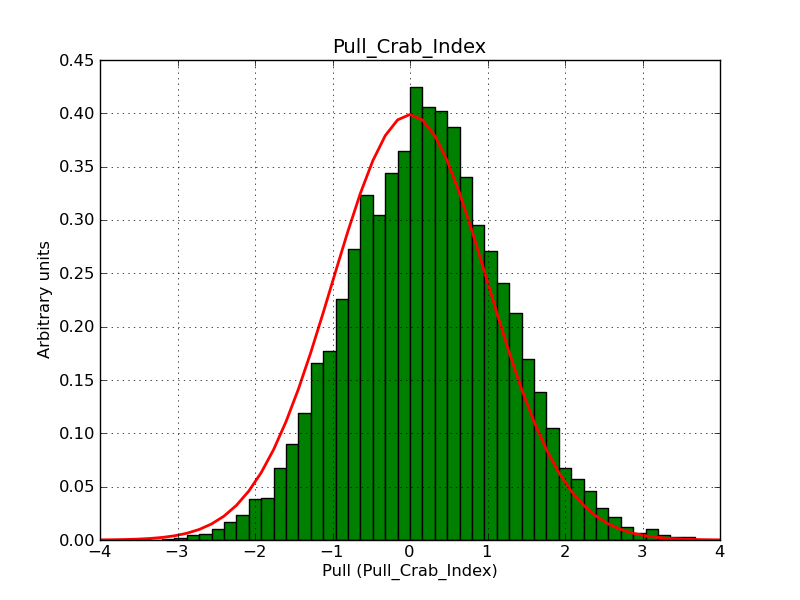
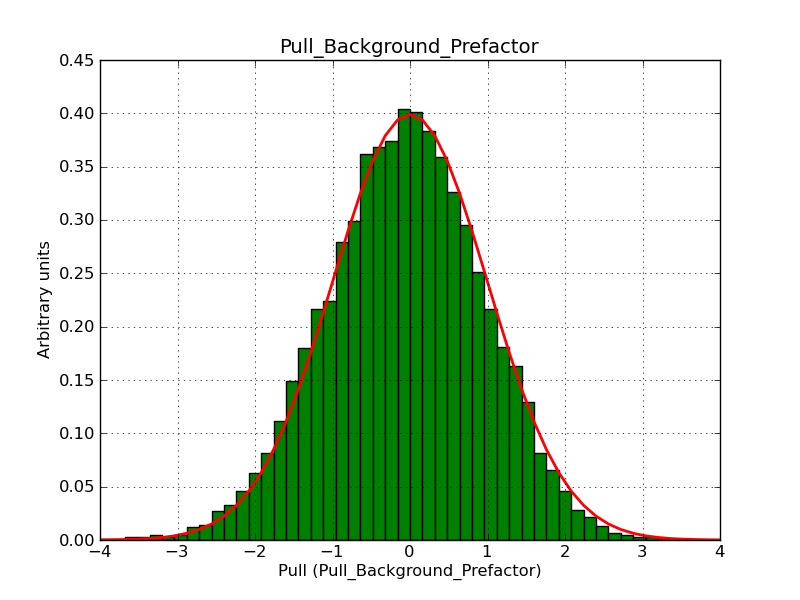
The following plot summarize the corresponding spectral components:
| Point source | 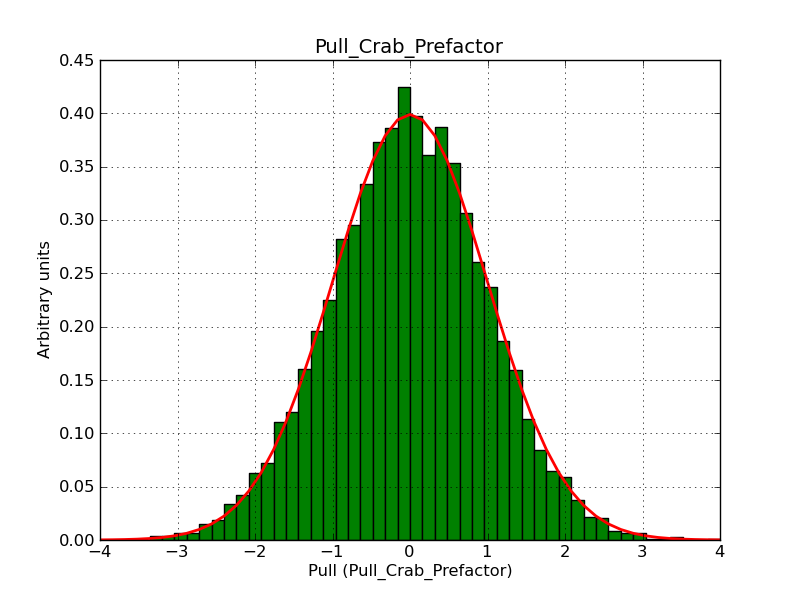 |
 |
 |
 |
| Disk |  |
 |
 |
 |
| Gaussian |  |
 |
 |
 |
| Shell | ||||
| Elliptical Disk |  |
 |
 |
 |
| Elliptical Gaussian | ||||
| Map | 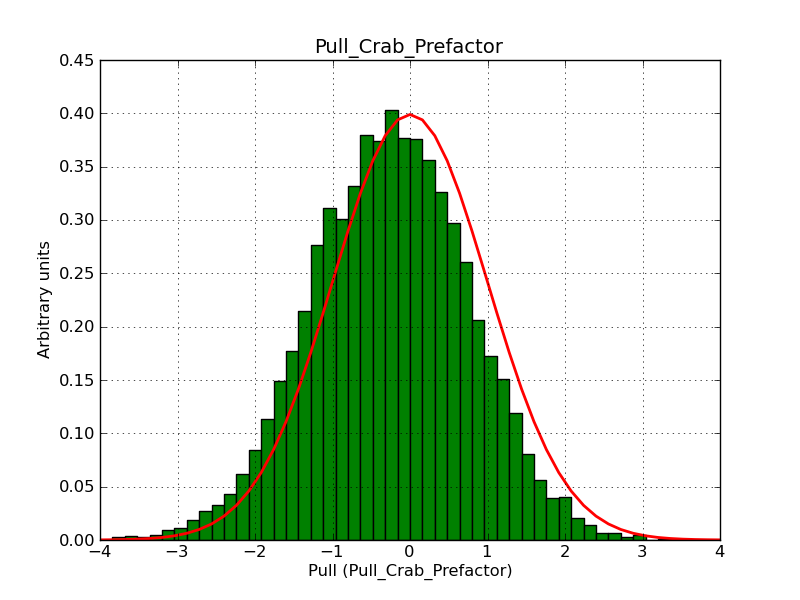 |
 |
 |
 |