 Knödlseder Jürgen
Updated over 8 years ago by
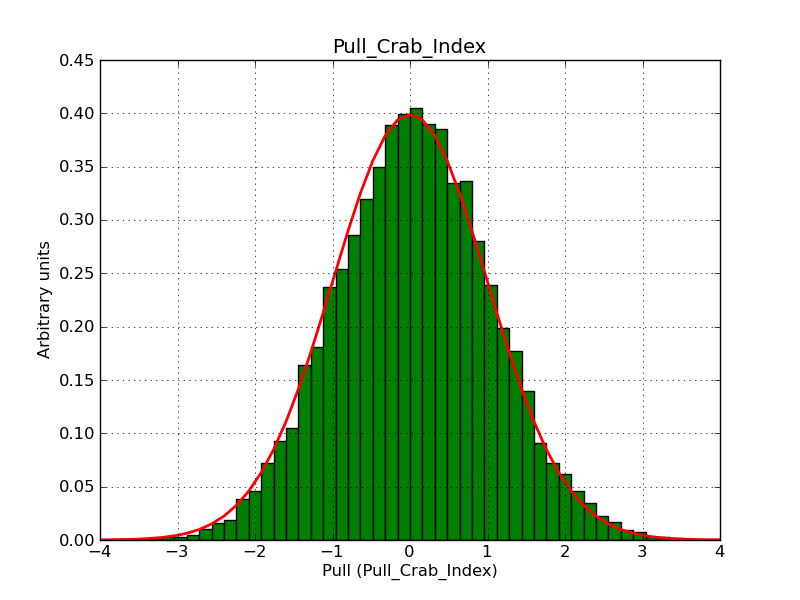
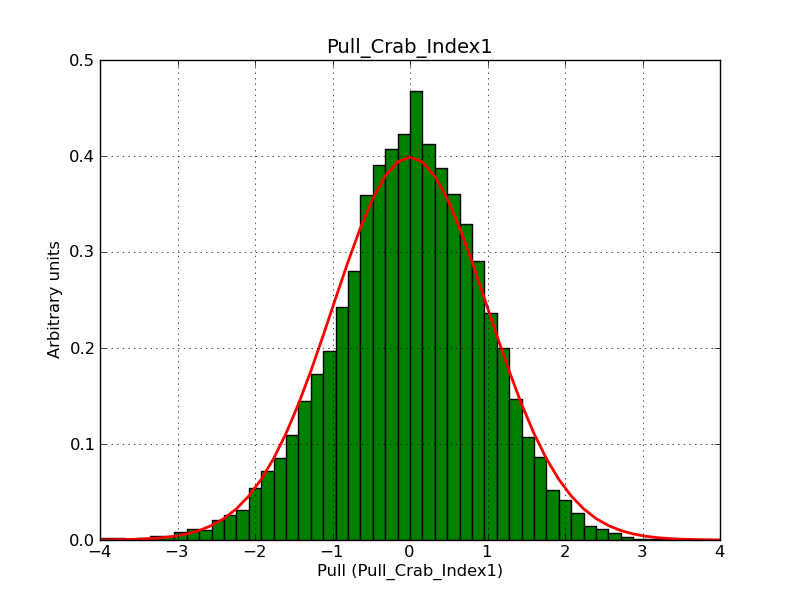
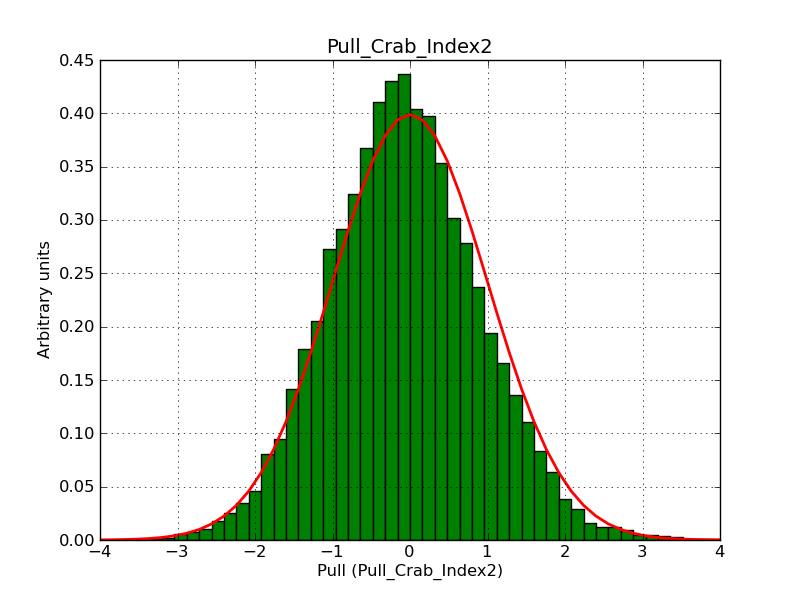
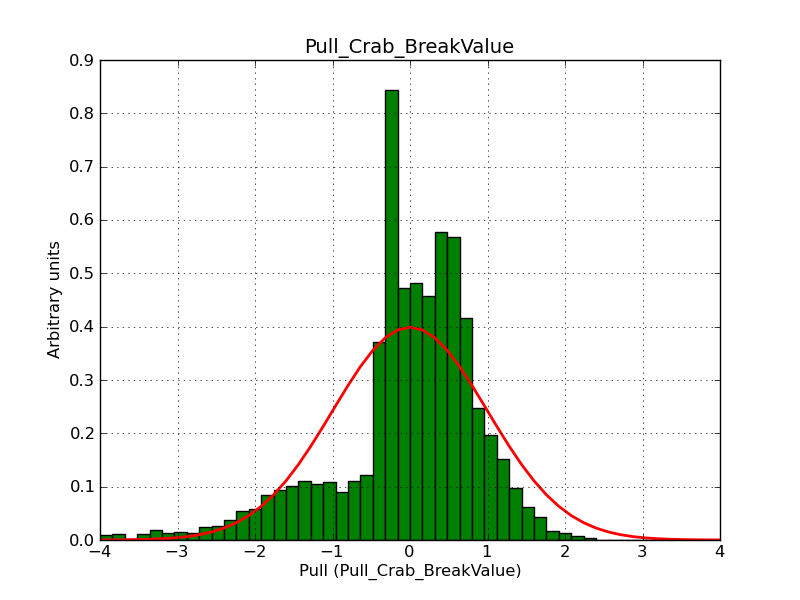
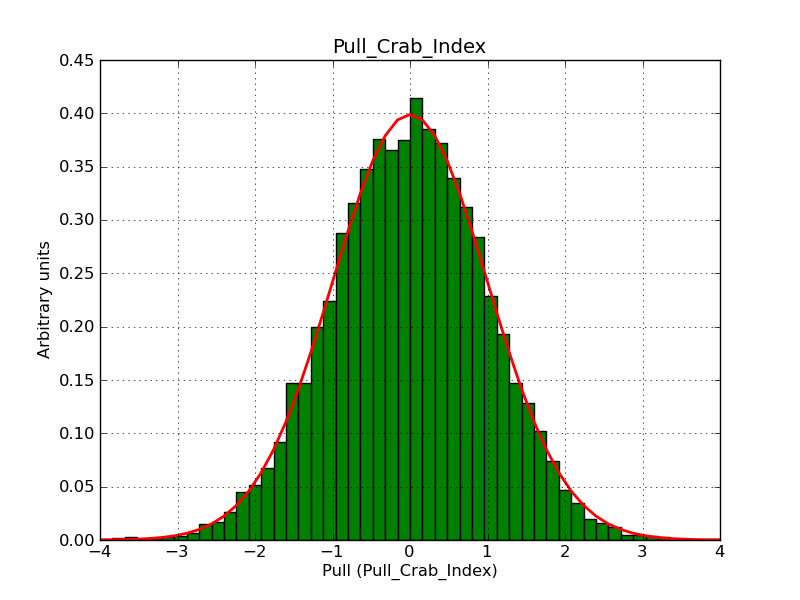
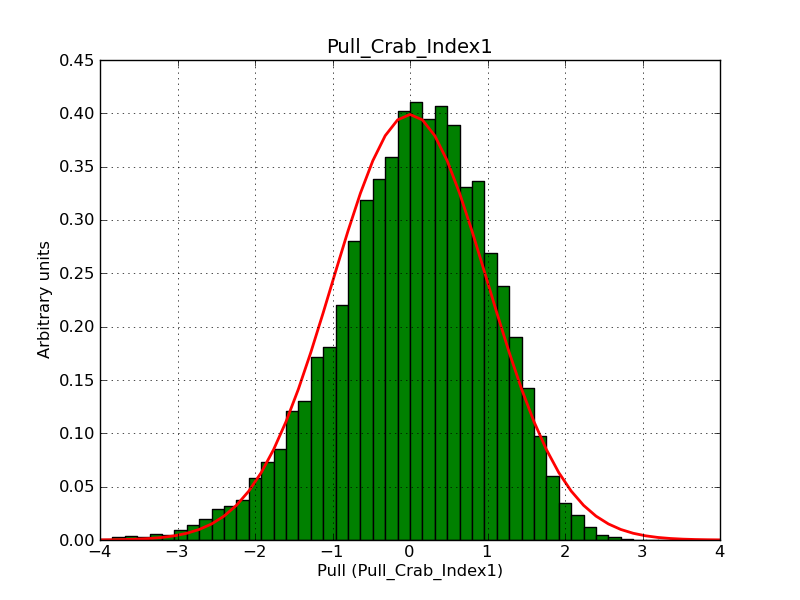
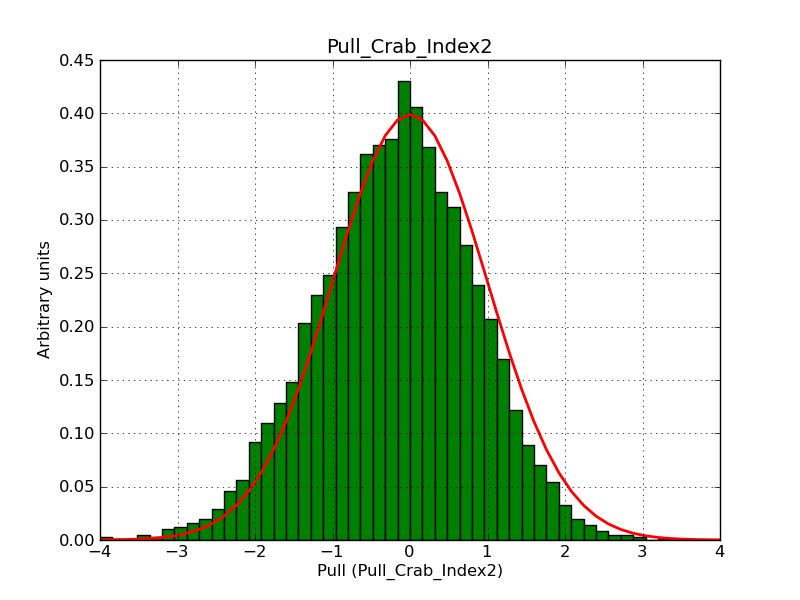
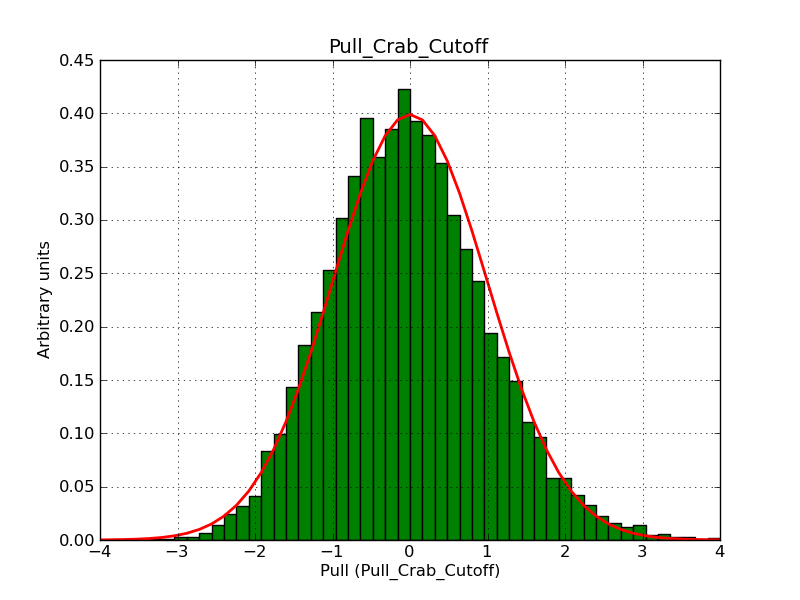
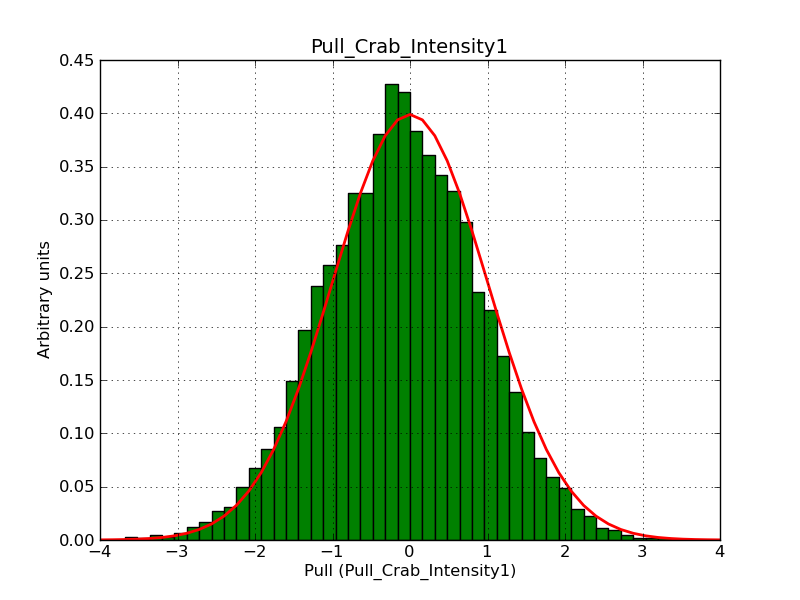
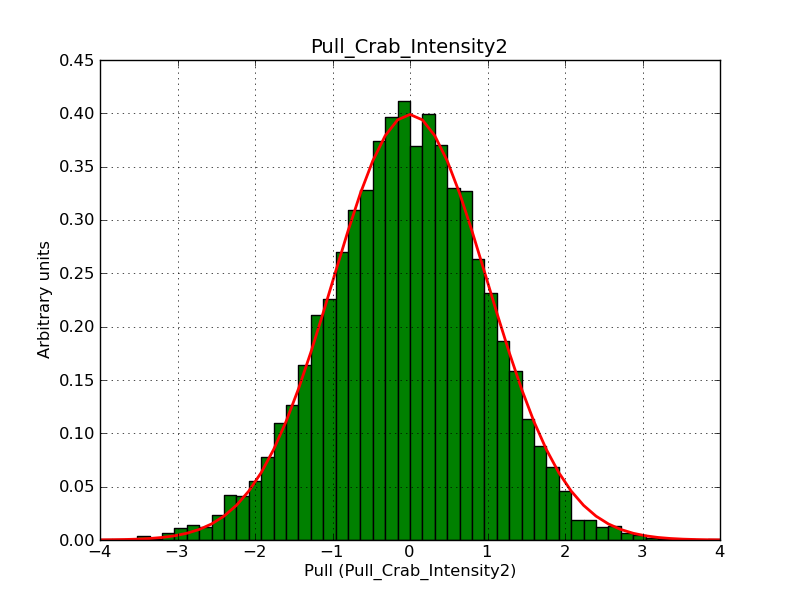
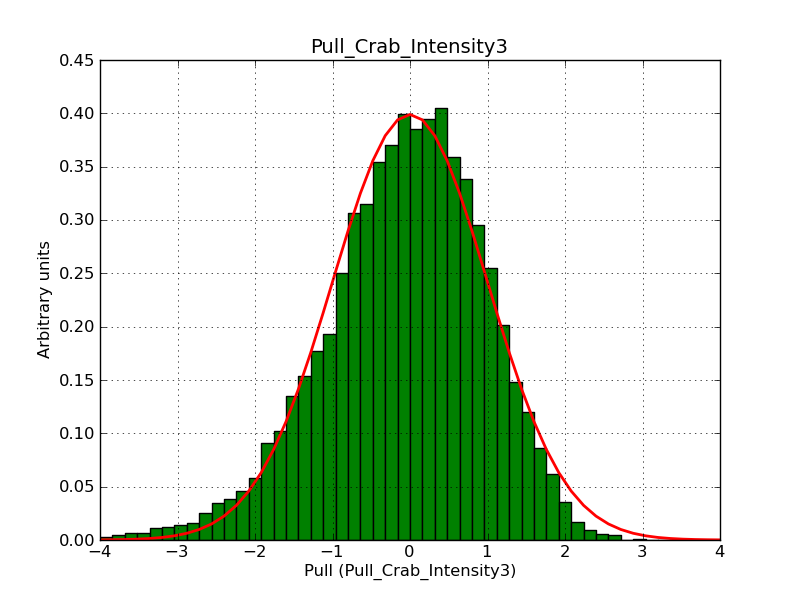
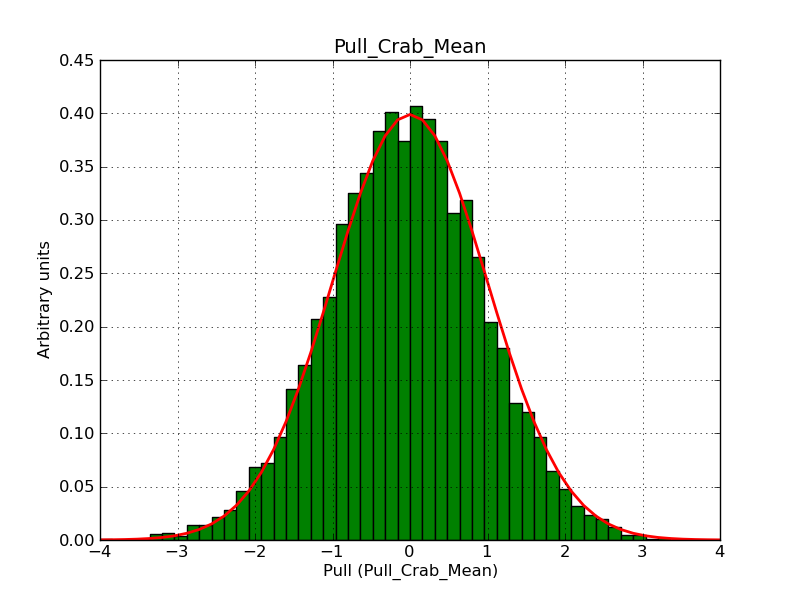
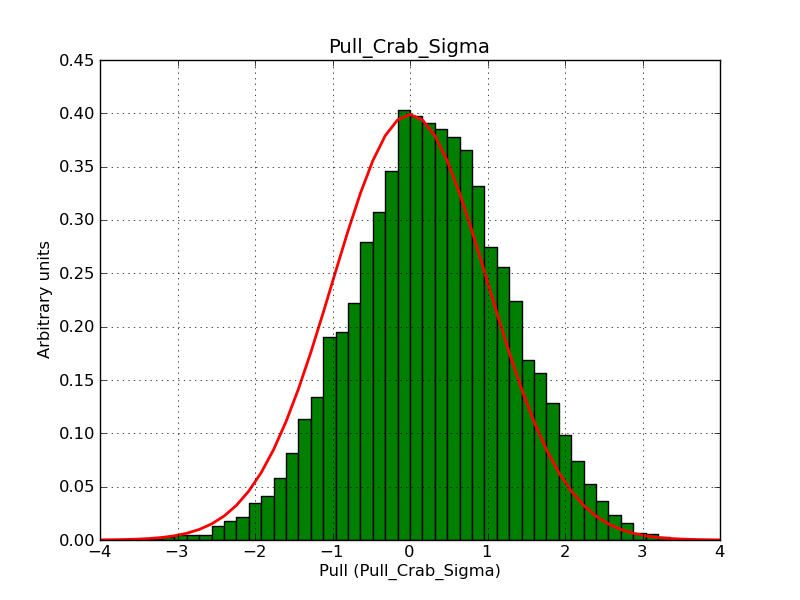
The following plots summarize the pull distributions for the spectral models obtained using a stacked analysis.
| Model | Bins | ||||
| Power law | 30 | 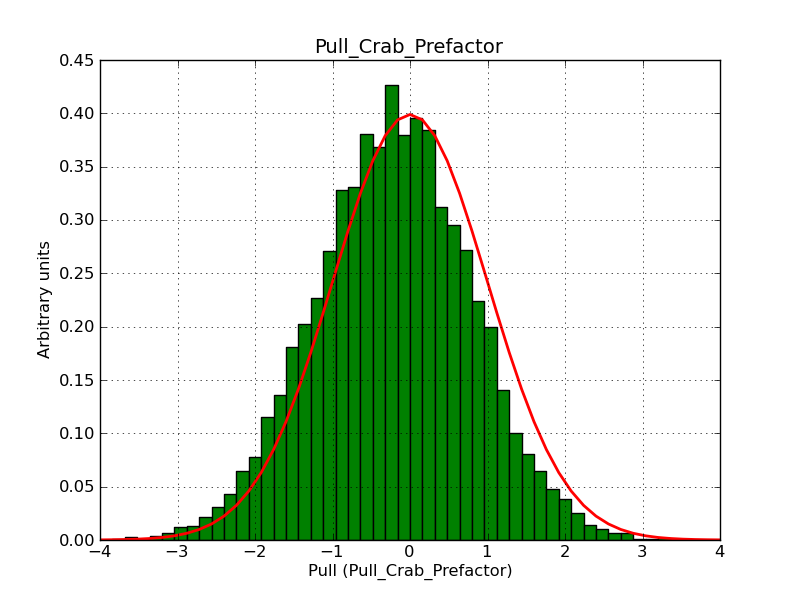 |
 |
||
| Power law 2 | 30 | 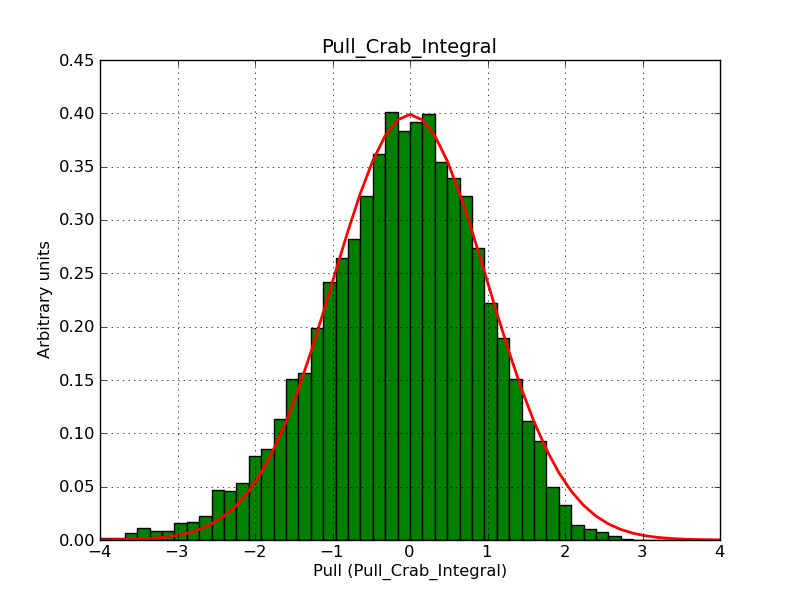 |
 |
||
| Broken power law | 30 | 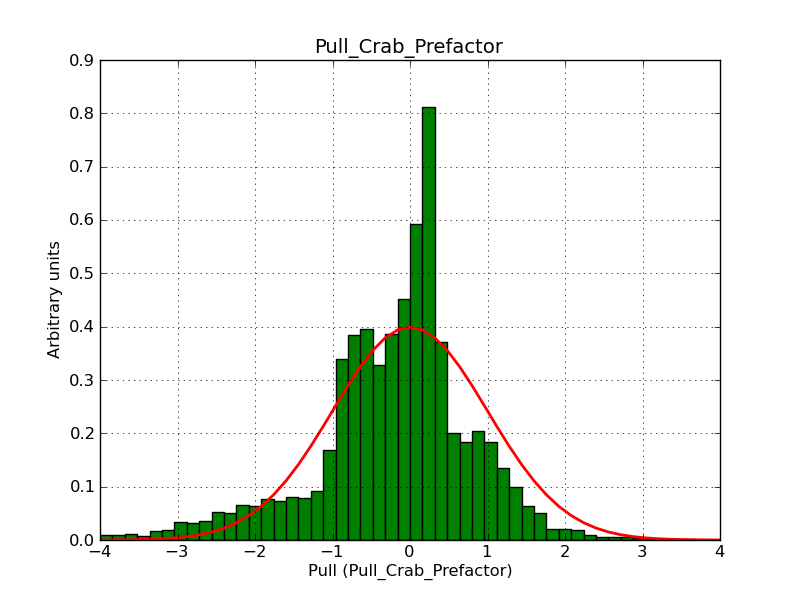 |
 |
 |
 |
| Exponential cut-off power law | 30 | 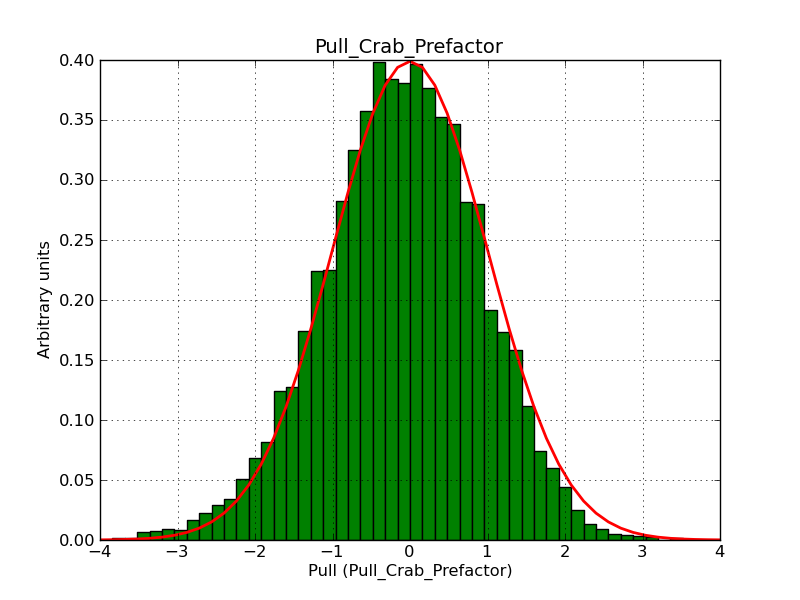 |
 |
 |
|
| Super exponential cut-off power law | 30 | 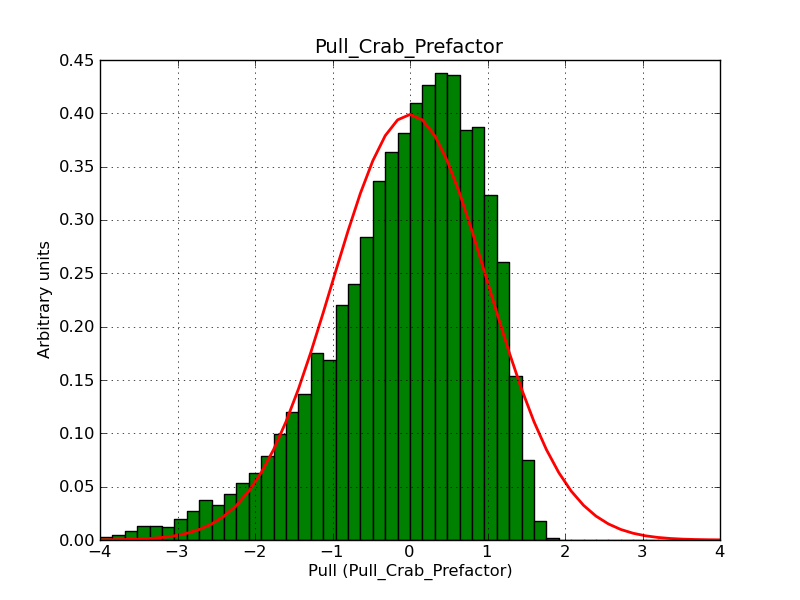 |
 |
 |
 |
| Log parabola | 60 | 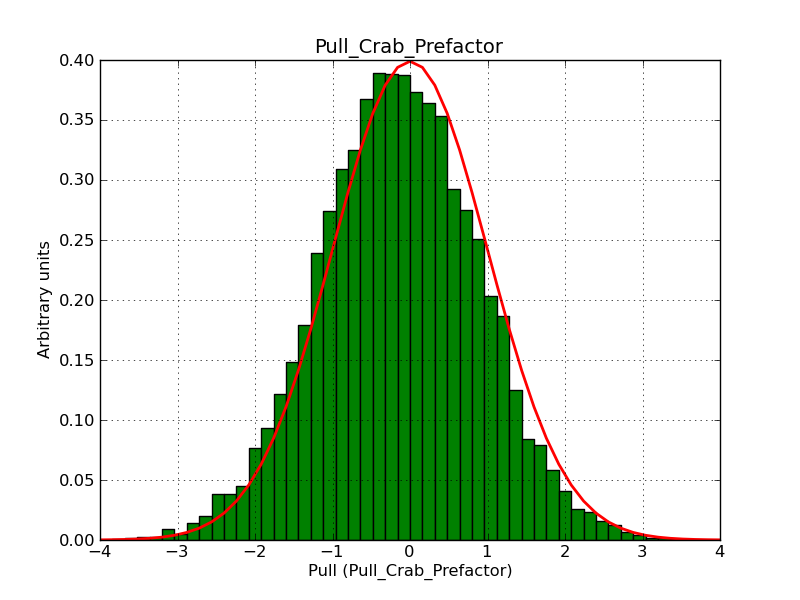 |
 |
 |
|
| File function | 30 | 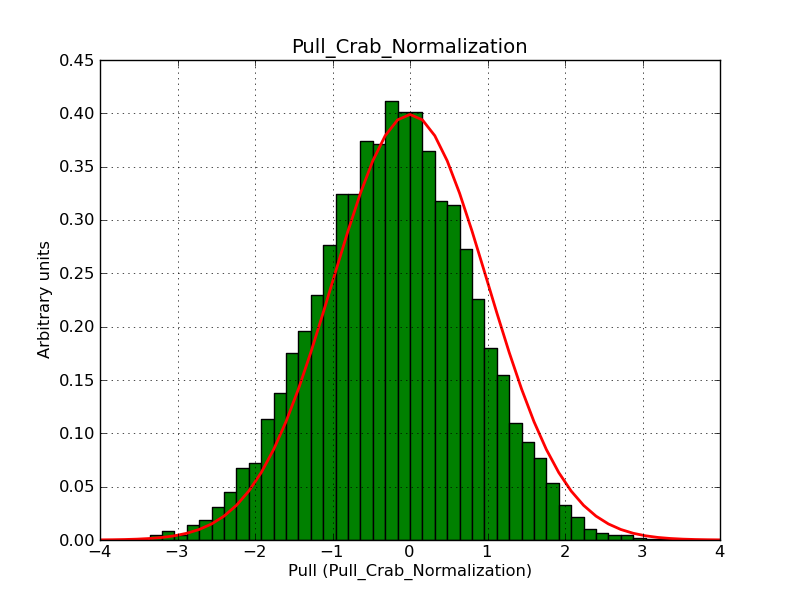 |
|||
| Node function | 30 | 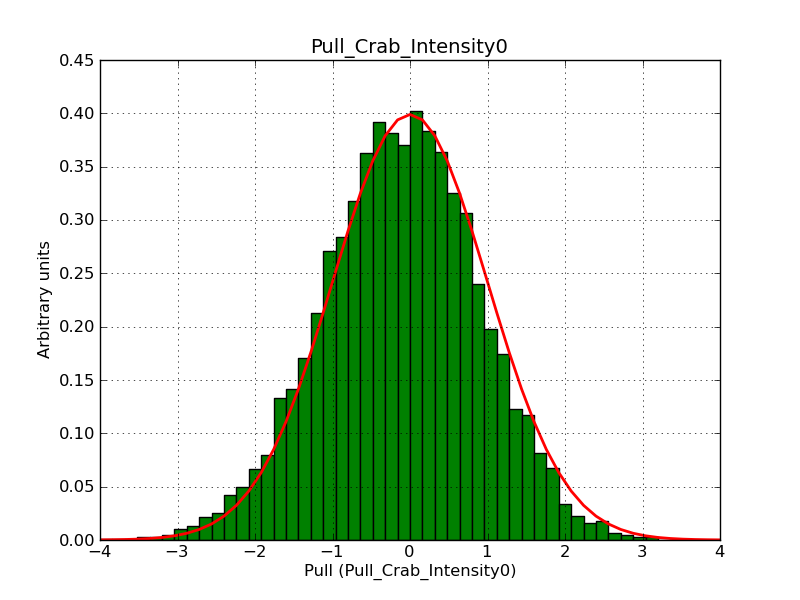 |
 |
 |
 |
| Gauss | 30 | 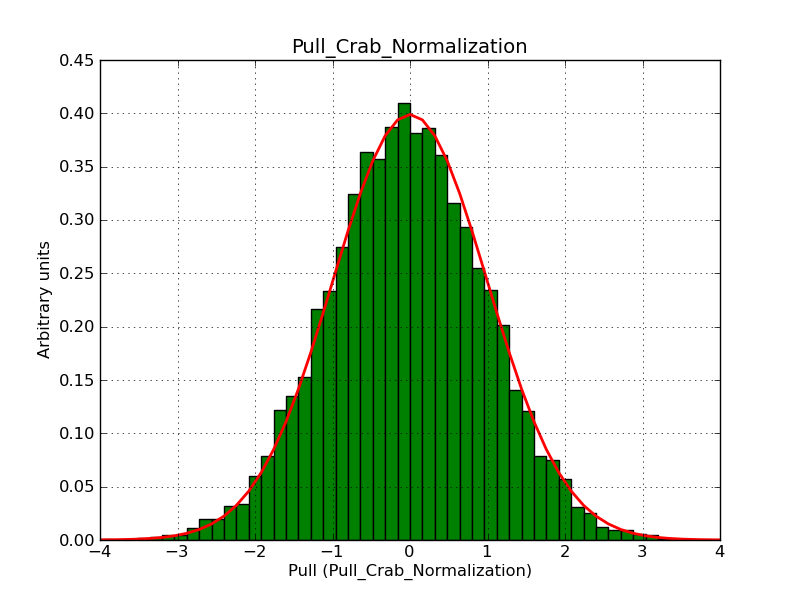 |
 |
 |