Support #2117

point source spectrum of ctmodel doesn't match ctbin
| Status: | New | Start date: | 05/22/2017 | |
|---|---|---|---|---|
| Priority: | Normal | Due date: | ||
| Assigned To: | - | % Done: | 0% | |
| Category: | - | |||
| Target version: | - | |||
| Duration: |
Description
I have a test crab analysis that I fit a simple PointSource and Plaw to, but when I integrate all the observed and modelled counts around the source, the totals don’t match up.
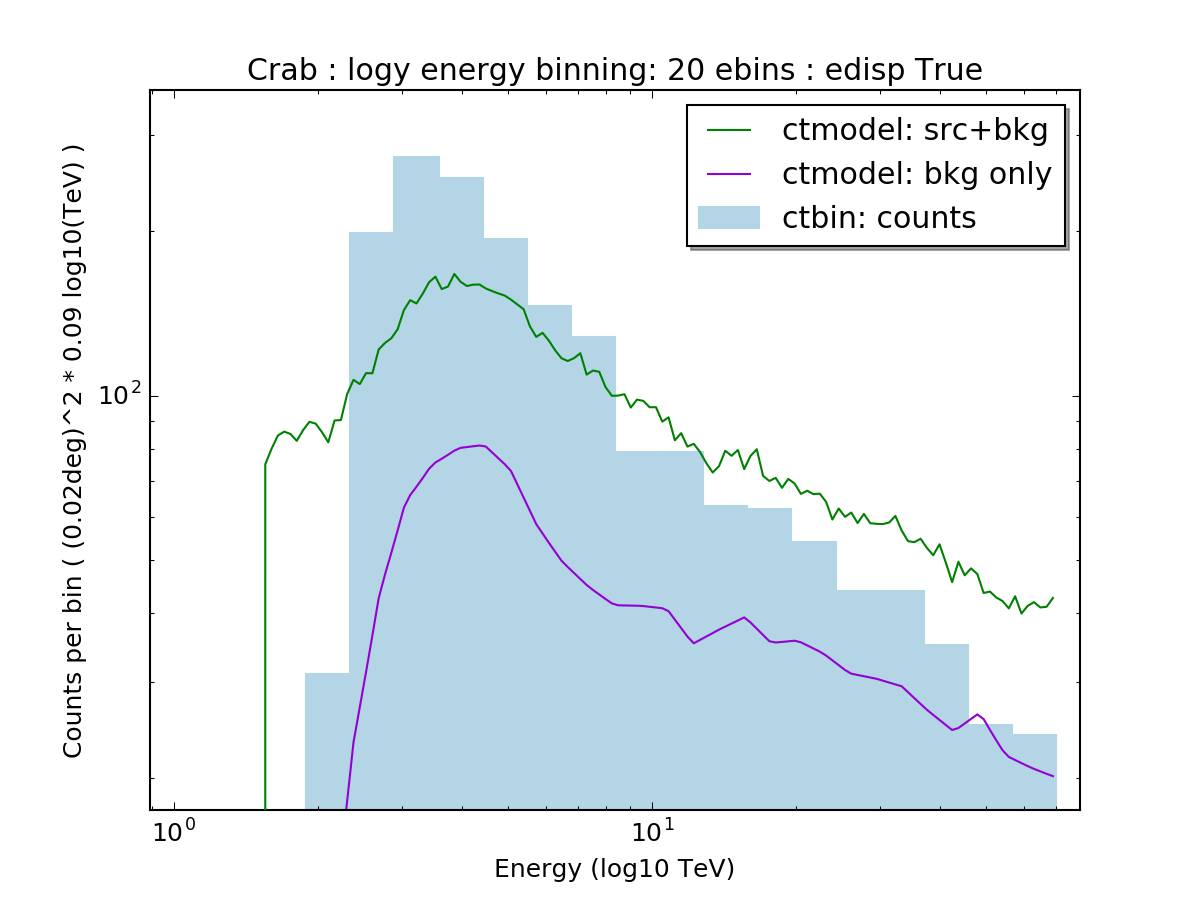
In the first plot “Crab Test Analysis: ctbin vs ctmodel”,
the blue histogram is the counts from ctbin. The green line is the total integrated counts from ctmodel from all models, while the purple line is just from the camera background models (i.e. everything except the Crab PointSource Plaw). The green line and the purple lines come from the same likelihood modelling fit.
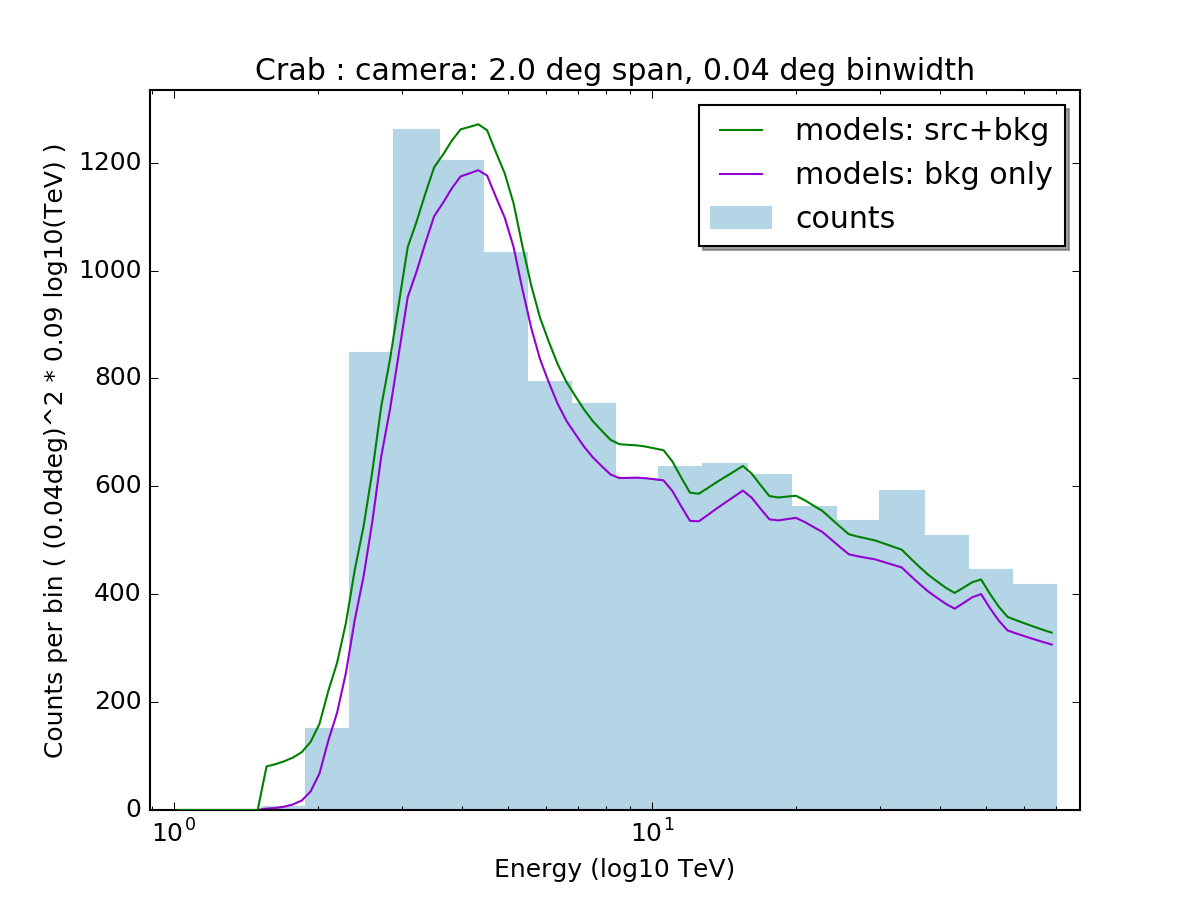
I was expecting the green 'total model-predicted counts’ line to match the blue 'total observed counts’ histograms, but they don’t, and I cant seem to understand why. Both the lines and the histogram are made by integrating over the position of the crab in a 0.5x0.5 deg square, using ~30x30 bins. When I zoom out in plot and integrate over a 2x2 deg square sky area, “Crab Test Analysis: 2x2deg integration area”, the spectrum looks much better, with models almost completely matching the counts (what I was expecting).
One possibility is that the GCTABackground3D I use for my background models is incorrectly defined spectrally. Since I store all backgrounds, psfs, effective areas, and energy dispersions in the same file as their event list, I use the two functions below to load each GCTAObservation (and GCTABackground3D as a model):
def load_chunk( fname ) :
  """Load fits file 'fname' and return a GCTAObservation object

  **Args:**
    fname : filename of fits file

  **Returns:**
    GCTAObservation() object
  """
  # initial
  check_if_file_exists( fname )
  run = GCTAObservation()

  # convert unicode to regular string
  if isinstance(fname, bytes) :
    fname = fname.decode('utf-8')
  run.load( fname )

  # parse the run and chunk id from the filename,
  # and set them in the run
  m = re.search( 'VR(\d+).*chunk(\d+)', fname )
  obsid = VeritasObsID()
  obsid.runnumber = int( m.group(1) )
  obsid.chunkid   = int( m.group(2) )
  run.id( obsid2str( obsid ) )

  # setup irfs
  #cal = GCaldb( os.path.dirname( os.path.abspath( fname ) ) )
  rsp = GCTAResponseIrf()
  rsp.load_aeff(       fname )
  rsp.load_psf(        fname )
  rsp.load_edisp(      fname )
  rsp.apply_edisp( True )
  rsp.load_background( fname )
  run.response( rsp )

  return run

def load_obs_proper( flist, bkg='constant') :
  """Load obs from fits filenames with backgrounds.

  Load each fits file into a GObservation object, including effarea, psf, and edisp tables.
  Create background model, and link it to it's GObservation object.

  **Args:**
    flist : list of strs, fits file paths to read in
    bkg   : str, [constant,powerlaw,none], setup backgrounds with this spectrum.
            powerlaw background is experimental and untested!

  """

  if bkg not in [ 'constant', 'powerlaw', None ] :
    raise ValueError('argument bkg must be either \'constant\', \'powerlaw\', or None, is currently %s' % bkg )

  obs = GObservations()

  for f in flist :
    run = load_chunk( f )
    obs.append( run )

    if bkg in ['constant','powerlaw'] :

      spec = 0
      if bkg == 'constant' :
        spec = GModelSpectralConst()

      back = GCTAModelIrfBackground( spec )
      back.name( '%sbkg_%s' % ( bkg, run.id() ) )
      back.ids( run.id() )
      back.instruments('VERITAS')
      obs.models().append( back )

    else :
      print("warning, attaching no background model for run from file '%s'" % f )

  # load all data from disk into memory
  for run in obs :
    run.events().fetch()

    # force the edisp to be fetched
    run.response().edisp().table()

  return obs
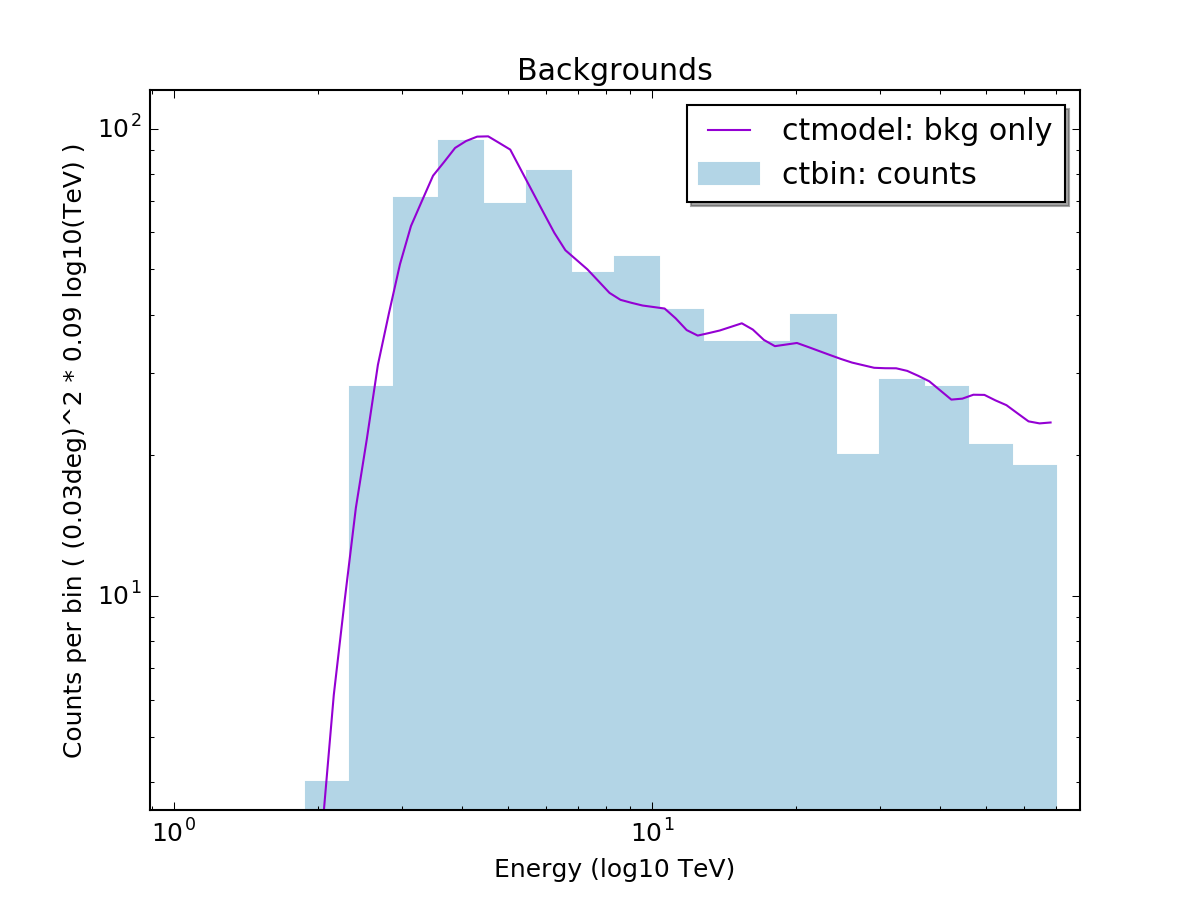
There is also a Background-Only Analysis. This consists of making GCTABackground3D backgrounds from dark runs (veritas runs with no gamma-ray sources), then fitting the dark runs back to the camera backgrounds. No other sources are present (either as actual emitters in the data, or as models). The spectra of observed (blue histogram) vs modelled(purple line) counts shows them to be in agreement.
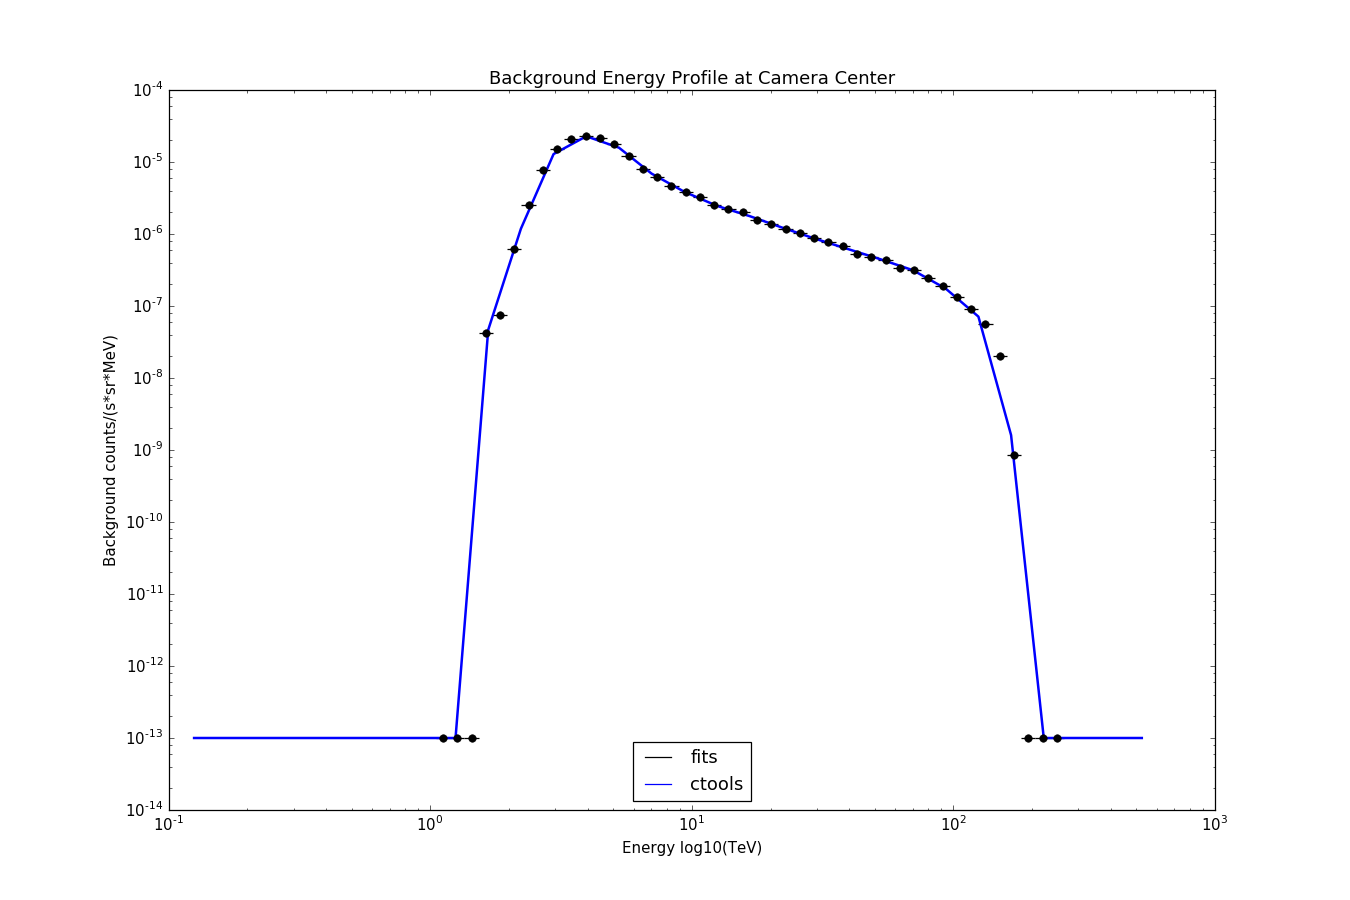
When I make a plot of the background value (at the camera center) vs energy, “GCTABackground3D Counts vs Energy”, it shows the value stored in the BACKGROUND fits table (black lines for the bin width and counts), and the blue line is the ctools-interpolated value after loading the table into ctools.
I’ve been stuck with this for a while. Does anyone have any ideas why my spectra is fine over the entire camera, but is way off near the point source?
eprofile.logy.edispTrue.png - Crab Test Analysis: ctbin vs ctmodel (95.3 KB)
eprofile.span2.0.png - Crab Test Analysis: 2x2deg integration area (108 KB)
background_profile.png - GCTABackground3D Counts vs Energy (56.4 KB)
eprofile.logy.backgrounds.png - Background-Only Analysis (66.1 KB)


Recurrence
No recurrence.
History
#1
 Updated by Knödlseder Jürgen over 7 years ago
Have you tested with switching off the energy dispersion?