Action #2342

Handle noisy CTA energy dispersion
| Status: | Closed | Start date: | 02/16/2018 | |
|---|---|---|---|---|
| Priority: | High | Due date: | ||
| Assigned To: |  Knödlseder Jürgen Knödlseder Jürgen | % Done: | 100% | |
| Category: | - | |||
| Target version: | 1.5.1 | |||
| Duration: |
Description
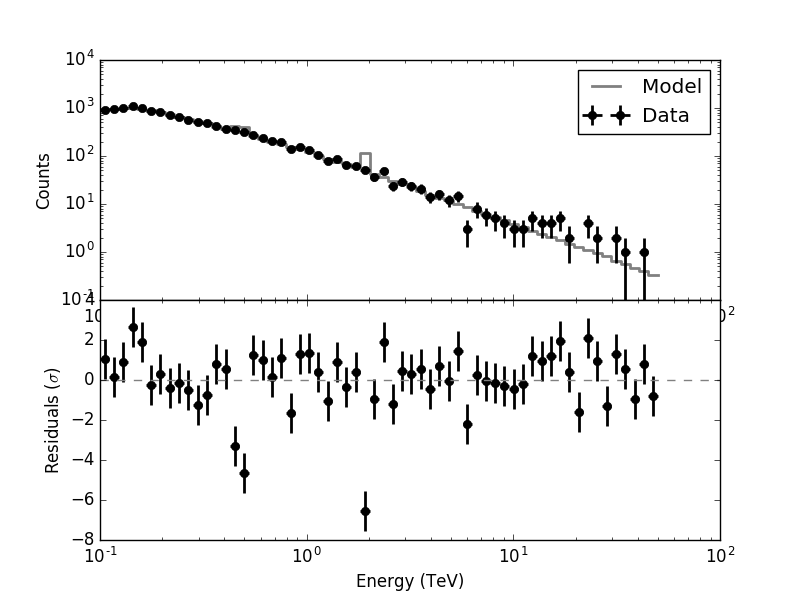
The energy dispersion histogram for CTA data are quite noisy, which turned out to pose problems in the fitting procedure when analysing the 1DC data. The issue can for example be seen in the following plot generated using csspecres of Cas A which shows a peak in the model spectrum near 2 TeV

specres_3D2_nosmooth.png (38.6 KB)
specres_3D2_etrue1.0.png (37.7 KB)
specres_3D2_etrue2.0.png (38.5 KB)
specres_3D2_etrue3.0.png (38.3 KB)
SED-etrue-smoothing.png (61.3 KB)
South_z20_50h.png (243 KB)
South_z20_50h_clip10.png (254 KB)
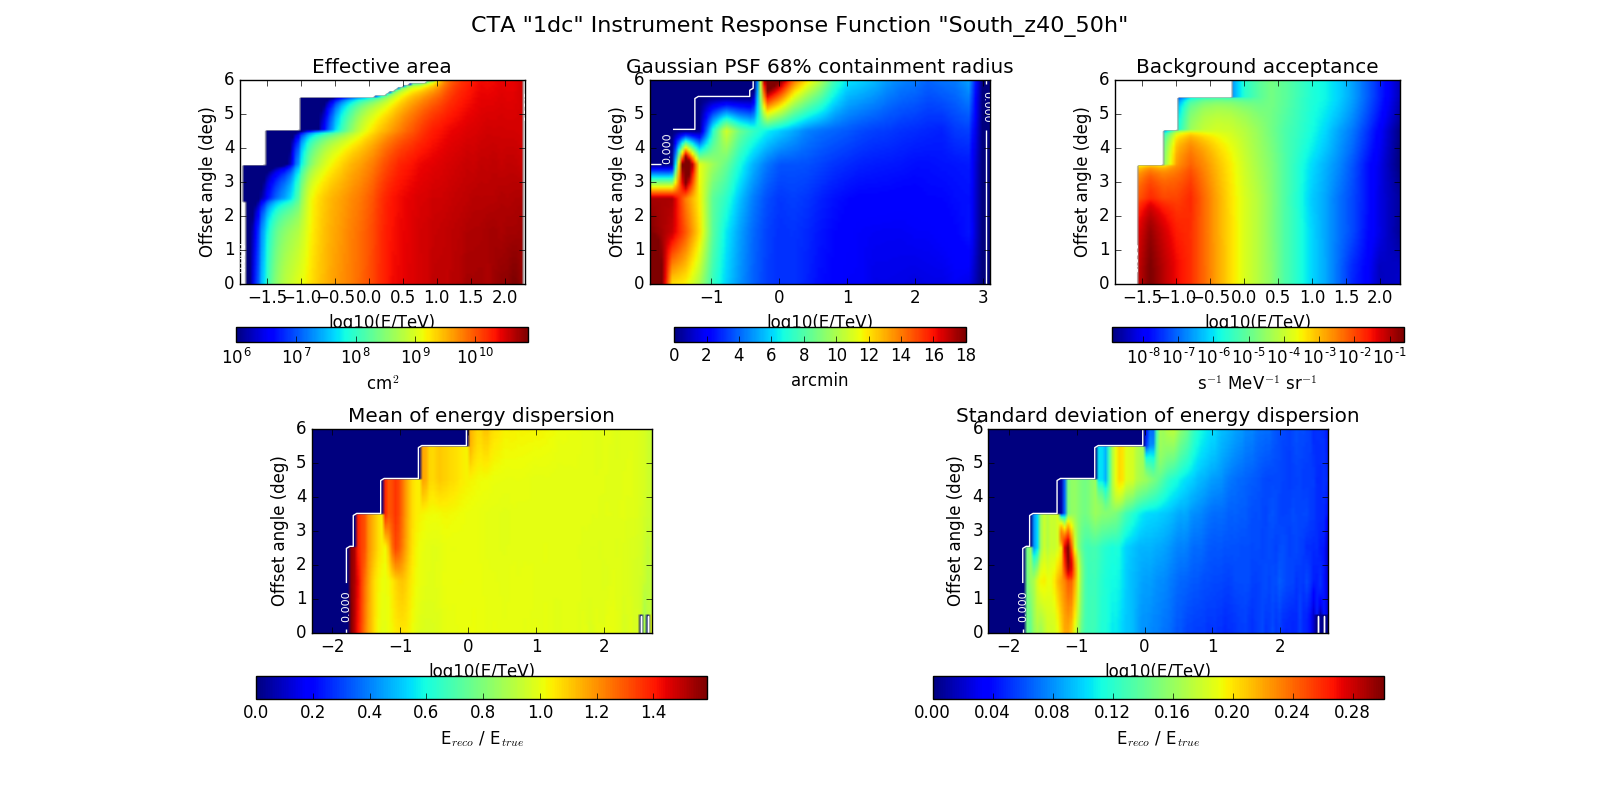
South_z40_50h.png (241 KB)
South_z40_50h_clip10.png (246 KB)
North_z20_50h.png (258 KB)
North_z20_50h_clip10.png (263 KB)
North_z40_50h.png (254 KB)
North_z40_50h_clip10.png (255 KB)
specres_3D2_onlyclipping.png (38.1 KB)
SED-onlyclipping.png (55.5 KB)
specres_3D.png (55.5 KB)
specres_3D_edisp.png (55.7 KB)
specres_3D_edisp_clipping.png (55.1 KB)
specres_3D_edisp_clipping_smoothing.png (55.7 KB)
North_z20_50h_clip15_smooth3.png (216 KB)
North_z40_50h_clip15_smooth3.png (203 KB)
South_z20_50h_clip15_smooth3.png (206 KB)
South_z40_50h_clip15_smooth3.png (198 KB)
hess_specres_3D_edisp_clipping_smoothing.png (48 KB)
hess_specres_3D_edisp.png (48.1 KB)
hess_specres_3D.png (47.2 KB)
energy-dispersion.pdf
(1.31 MB)


Recurrence
No recurrence.
History
#1
 Updated by Knödlseder Jürgen about 7 years ago
- File specres_3D2_etrue1.0.png added
- File specres_3D2_etrue2.0.png added
- File specres_3D2_etrue3.0.png added
- File SED-etrue-smoothing.png added
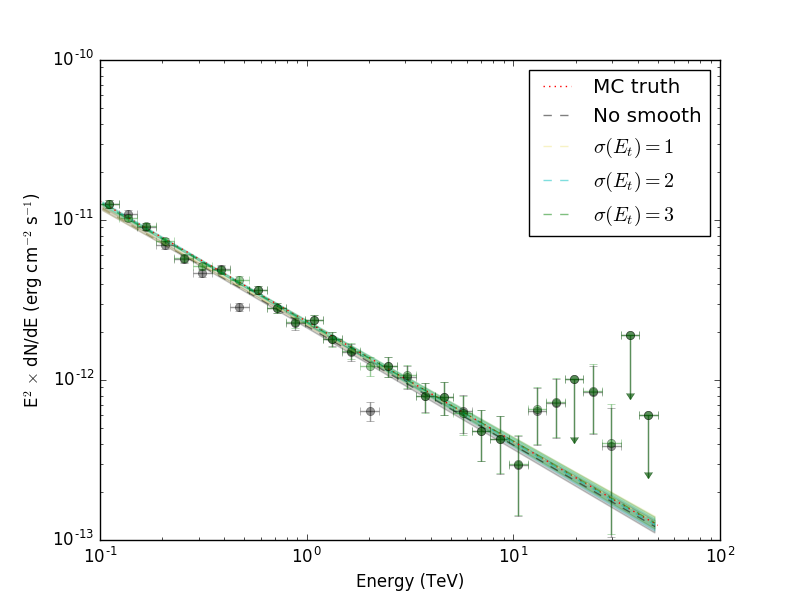
It turned out that the problem is related to the noise in the energy dispersion histogram. Smoothing and clipping that histogram in the true energy direction using a Gaussian with sigma of 1, 2 and 3 pixels gives the following results:
 |
 |
 |
The peak disappears, and from sigma=2 on the residuals are fine. A check of the fitted values with ctlike also shows that the true spectral values are well recovered with that smoothing. The resulting butterfly and spectral points, generated with ctbutterfly and csspec, are shown below:

#2
Updated by Knödlseder Jürgen about 7 years ago
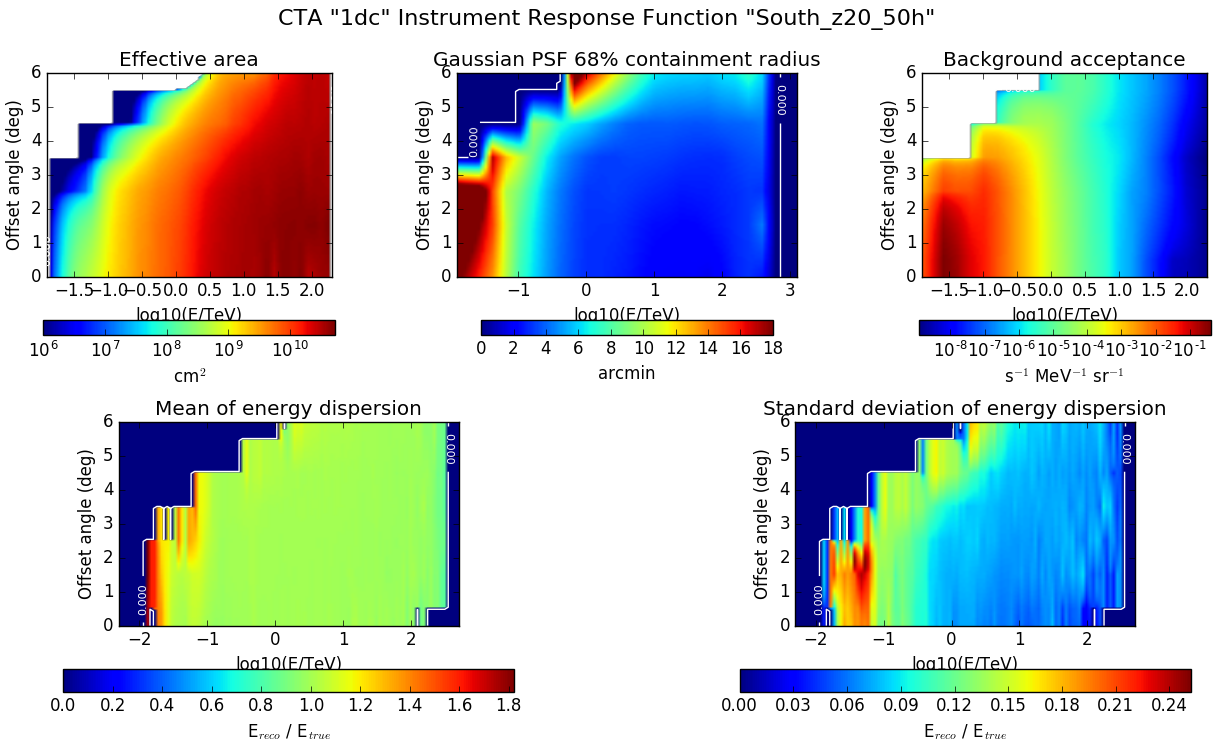
- File South_z20_50h.png added
- File South_z20_50h_clip10.png added
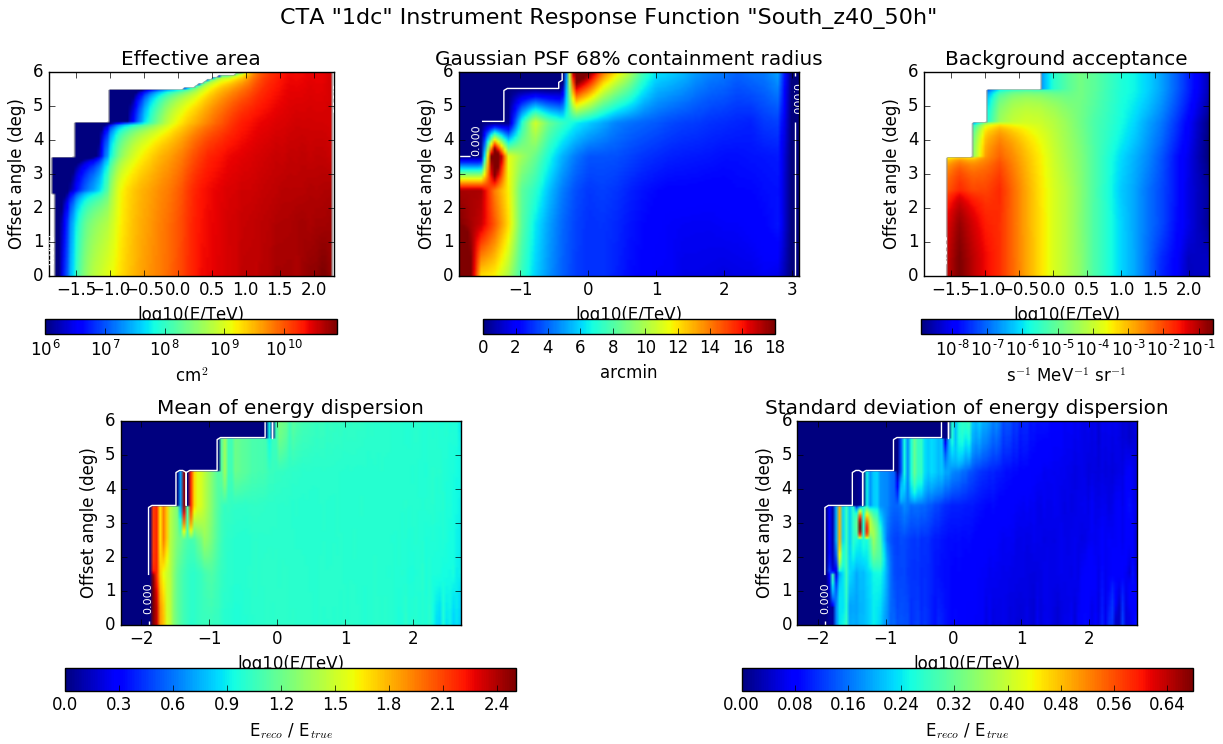
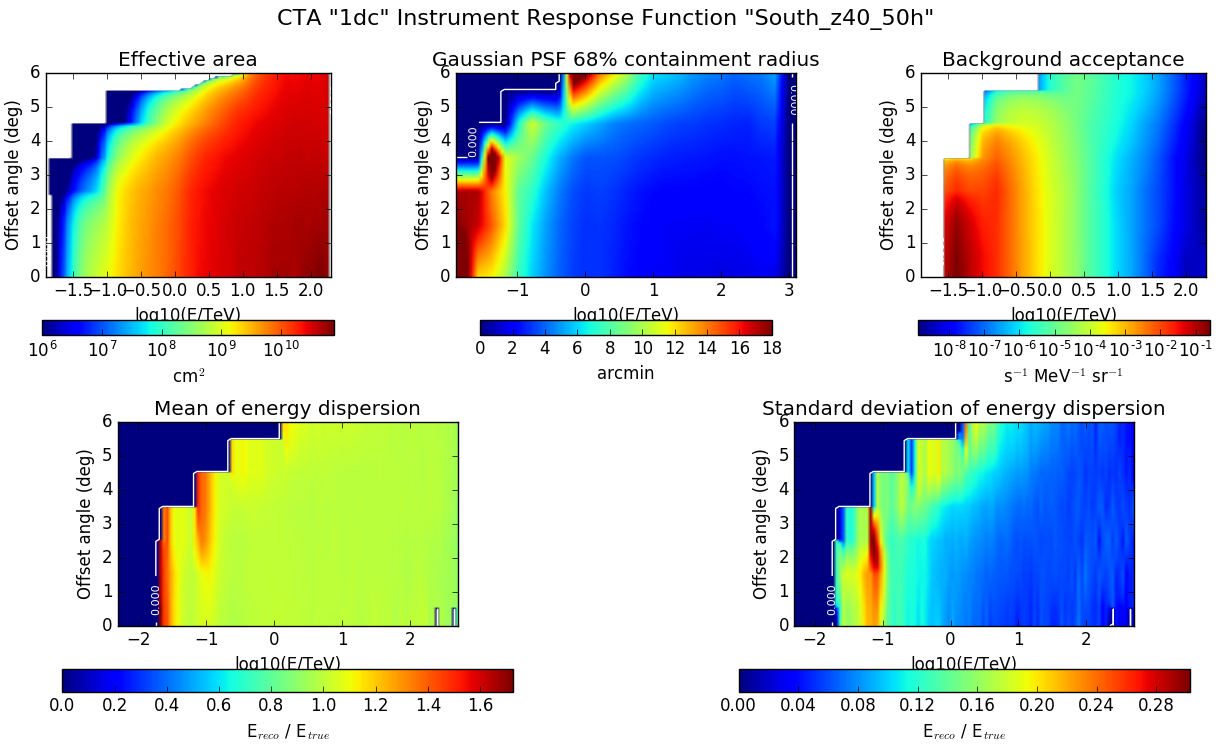
- File South_z40_50h.png added
- File South_z40_50h_clip10.png added
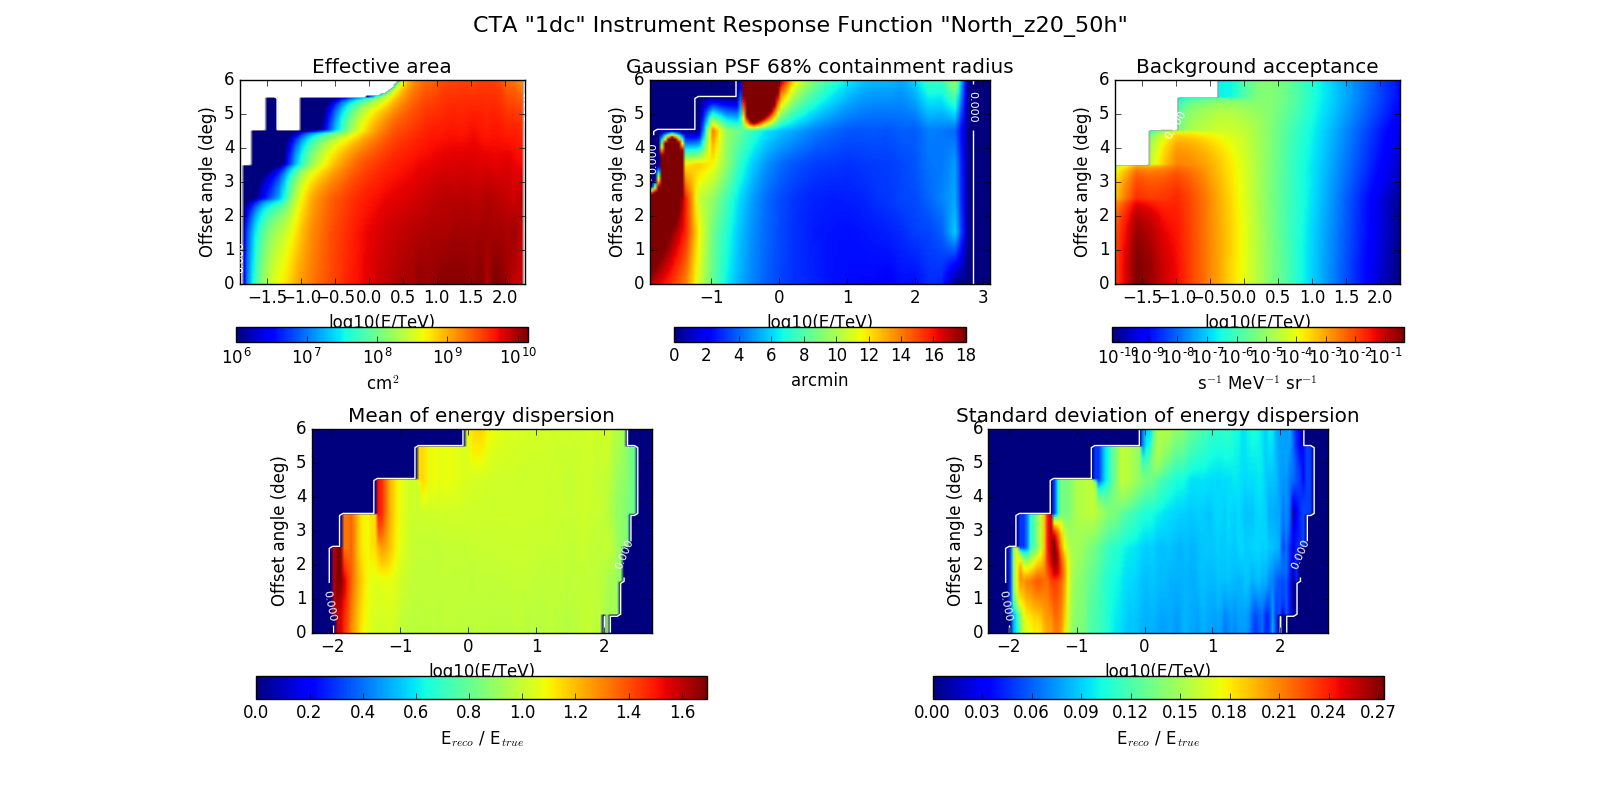
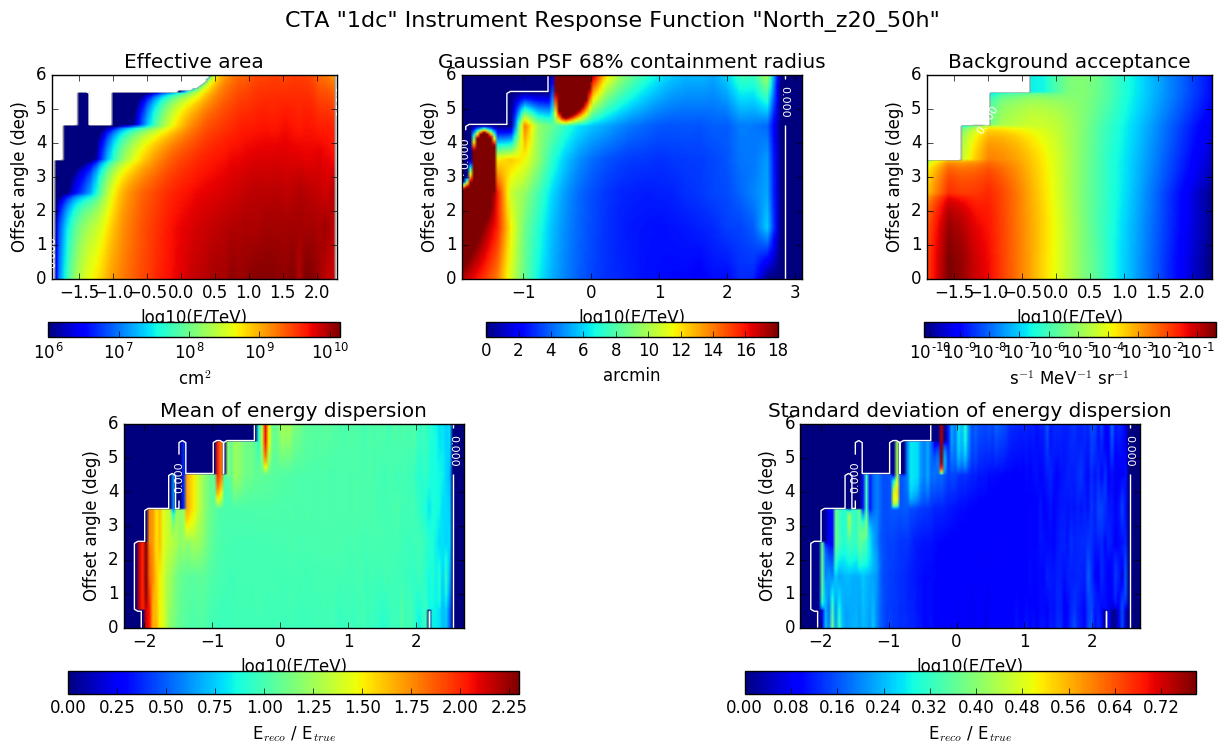
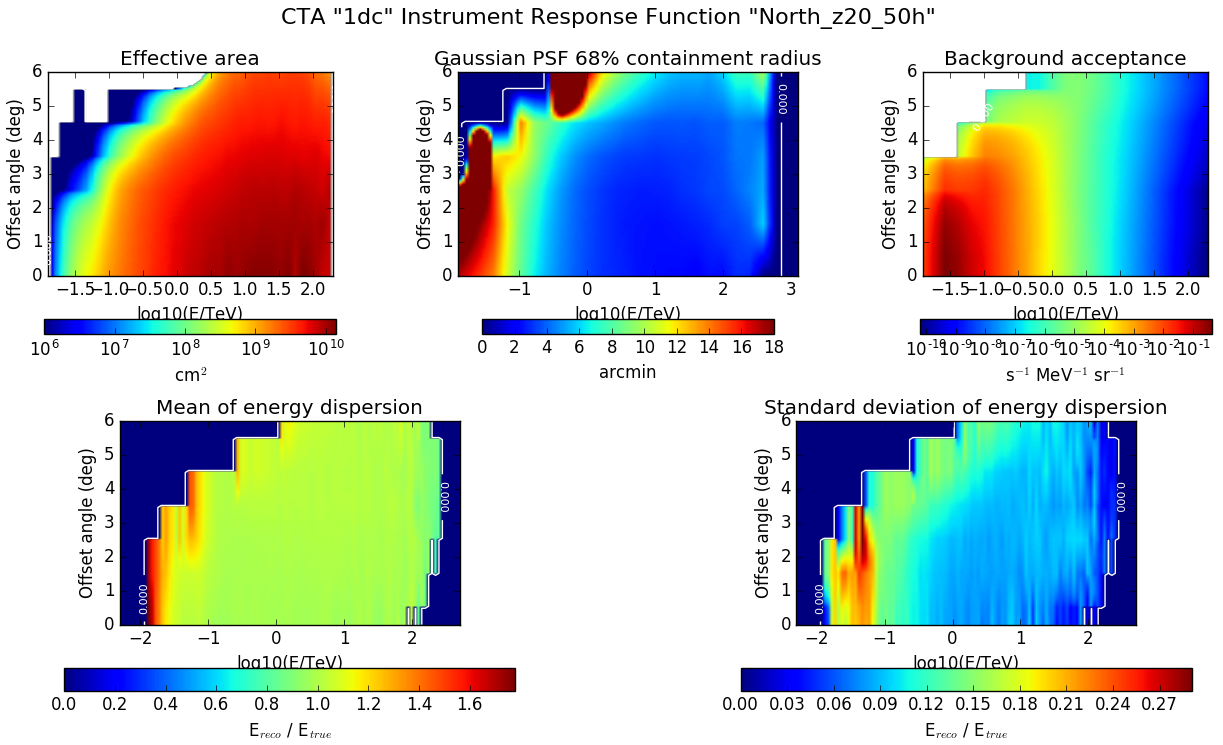
- File North_z20_50h.png added
- File North_z20_50h_clip10.png added
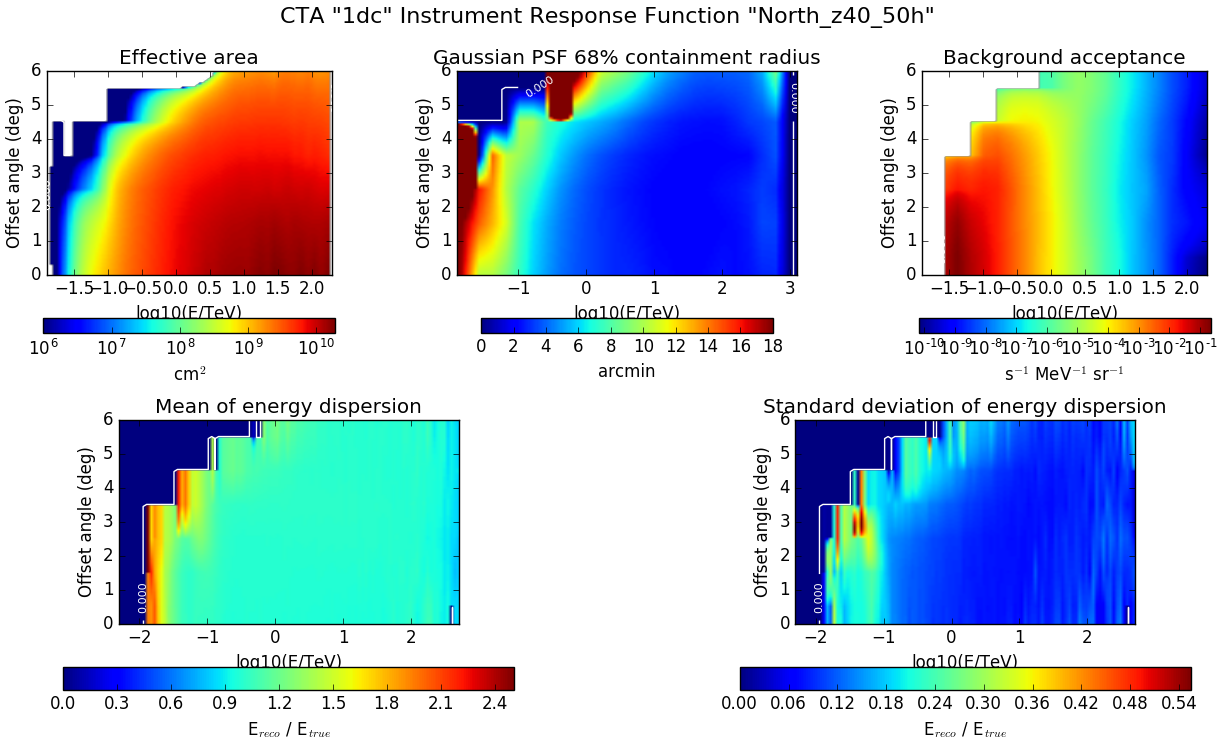
- File North_z40_50h.png added
- File North_z40_50h_clip10.png added
- File specres_3D2_onlyclipping.png added
- File SED-onlyclipping.png added
- Status changed from New to In Progress
- % Done changed from 0 to 50
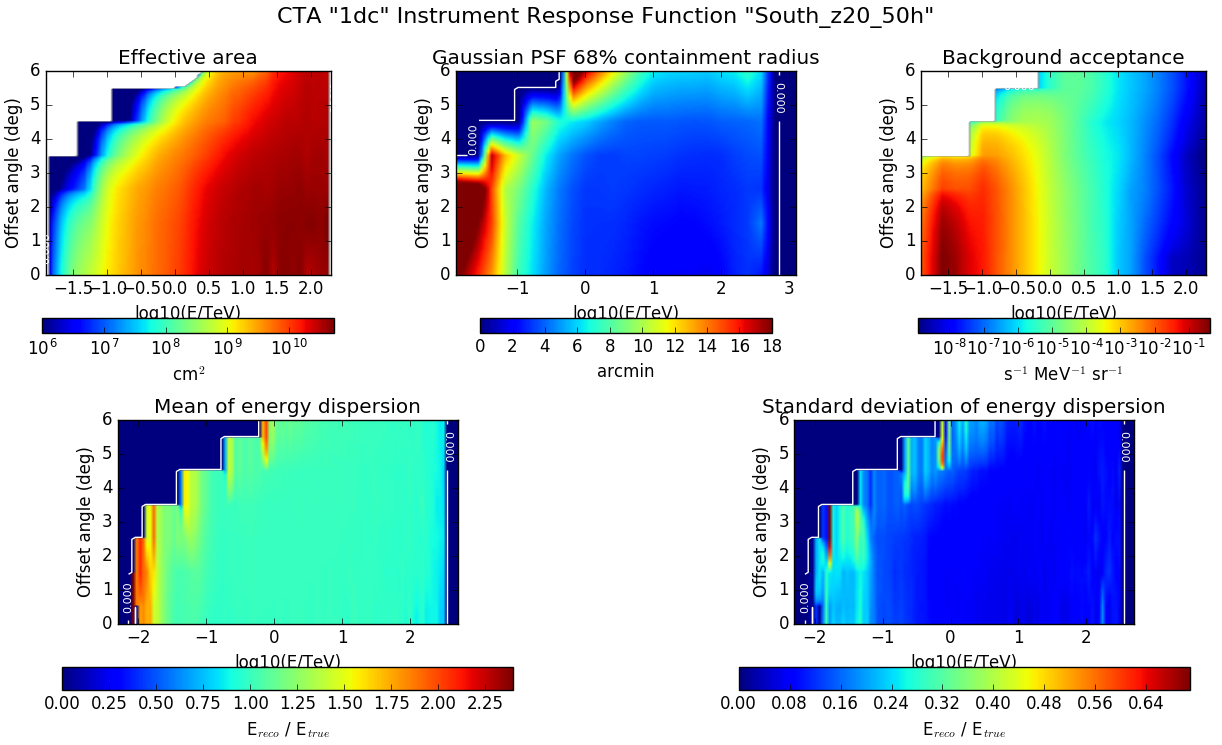
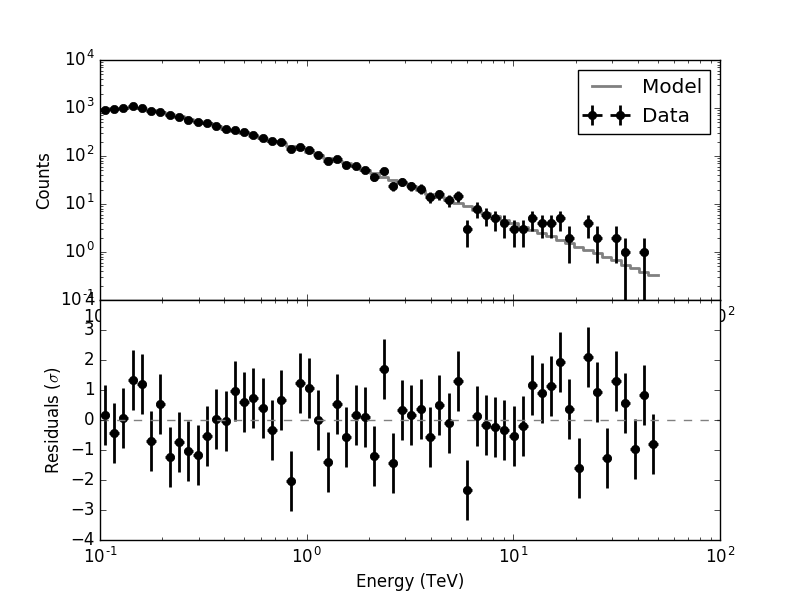
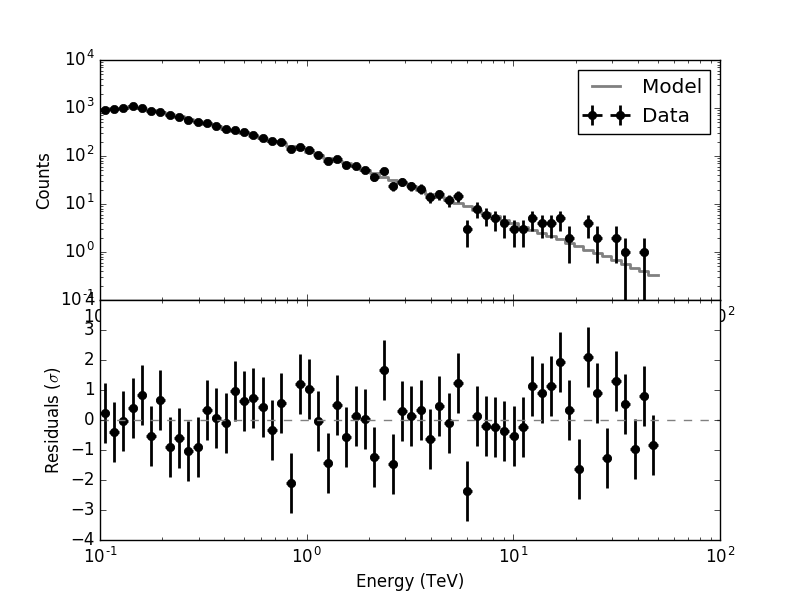
I tried an alternative method which seems to be more robust, and which consists of clipping outlying pixels in the energy dispersion matrix. I implemented this algorithm as a kludge in GCTAEdisp2D. Below a comparison of the IRFs:
| Original | Clipped |
 |
 |
 |
 |
 |
 |
 |
 |
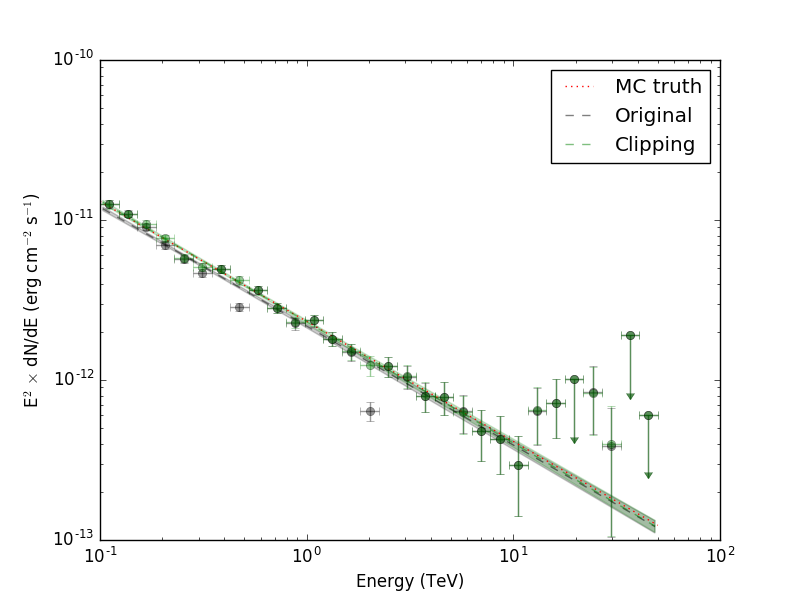
The residual spectrum looks good:
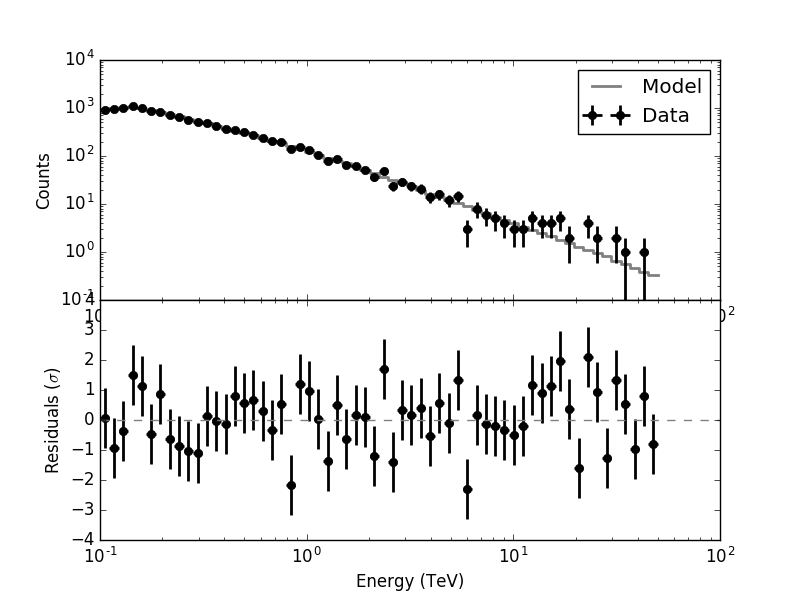
And also the butterfly and SED are okay:

#3
Updated by Knödlseder Jürgen about 7 years ago
- File specres_3D.png added
- File specres_3D_edisp.png added
- File specres_3D_edisp_clipping.png added
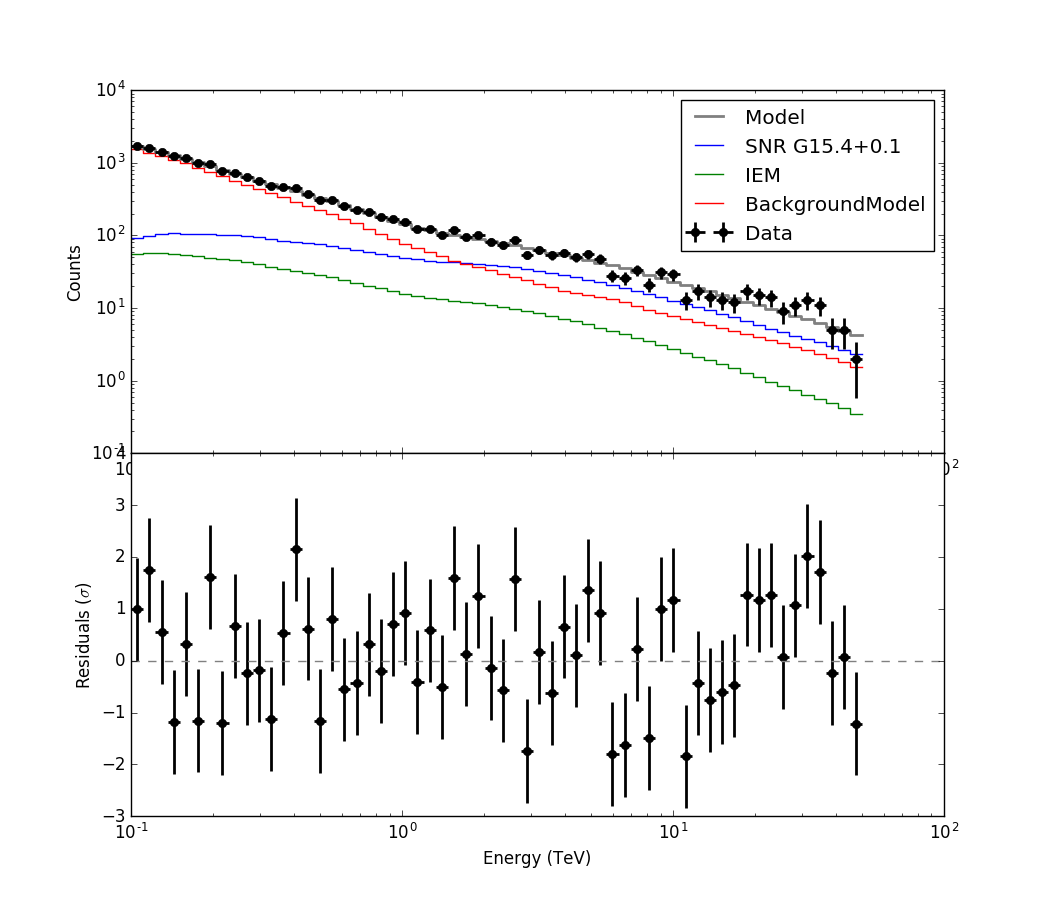
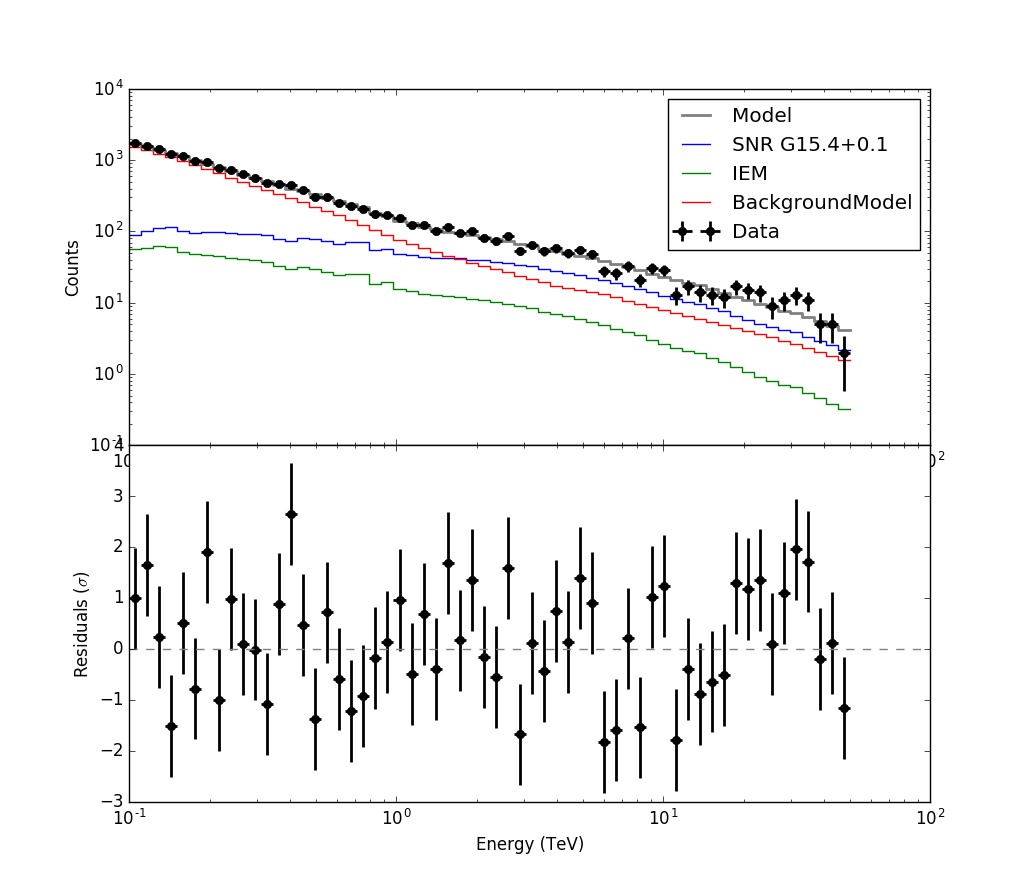
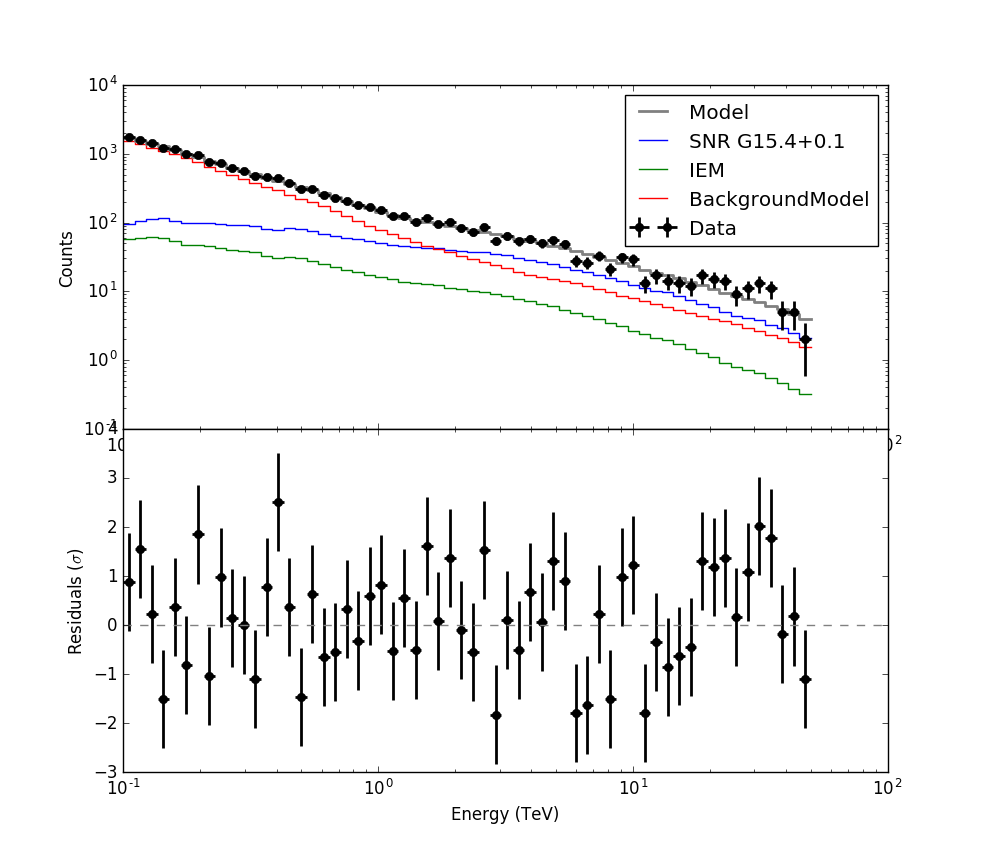
I tested the same procedure on G15.4+0.1 to check a source that is seen with the Southern array. Specifically, the South_z20_50h IRF is used for this source.
Below the residual spectra without energy dispersion, with energy dispersion, with a clipped energy dispersion and with a clipped and smoothed energy dispersion.
No Edisp  |
Edisp  |
Clipped Edisp  |
Clipped and smoothed Edisp 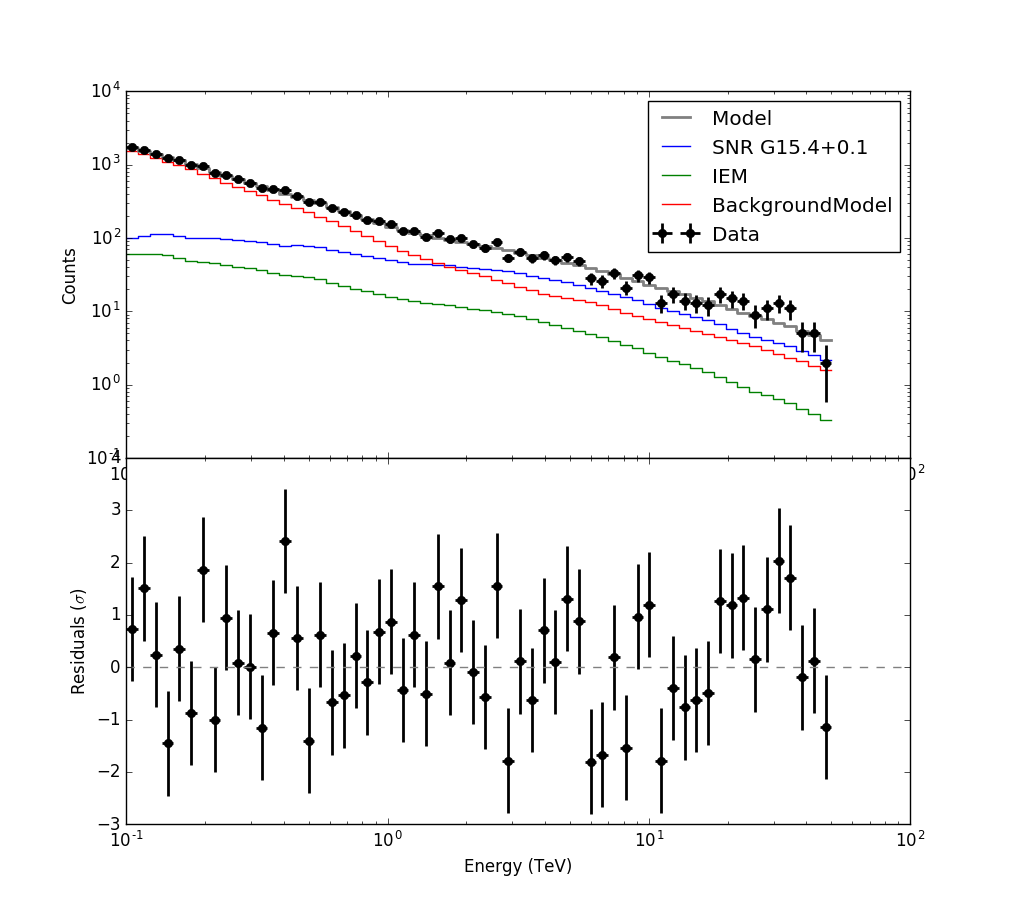 |
There is clearly some structure visible in the source and interstellar emission model at low energies when the energy dispersion is used, and this structure becomes weaker - though does not completely disappear - when clipped energy dispersion is used. I therefore added back some smoothing, which resulted in the last image. Still not perfect, but hopefully acceptable.
#4
Updated by Knödlseder Jürgen about 7 years ago
- File specres_3D_edisp_clipping_smoothing.png added
#5
Updated by Knödlseder Jürgen about 7 years ago
- File North_z20_50h_clip15_smooth3.png added
- File North_z40_50h_clip15_smooth3.png added
- File South_z20_50h_clip15_smooth3.png added
- File South_z40_50h_clip15_smooth3.png added
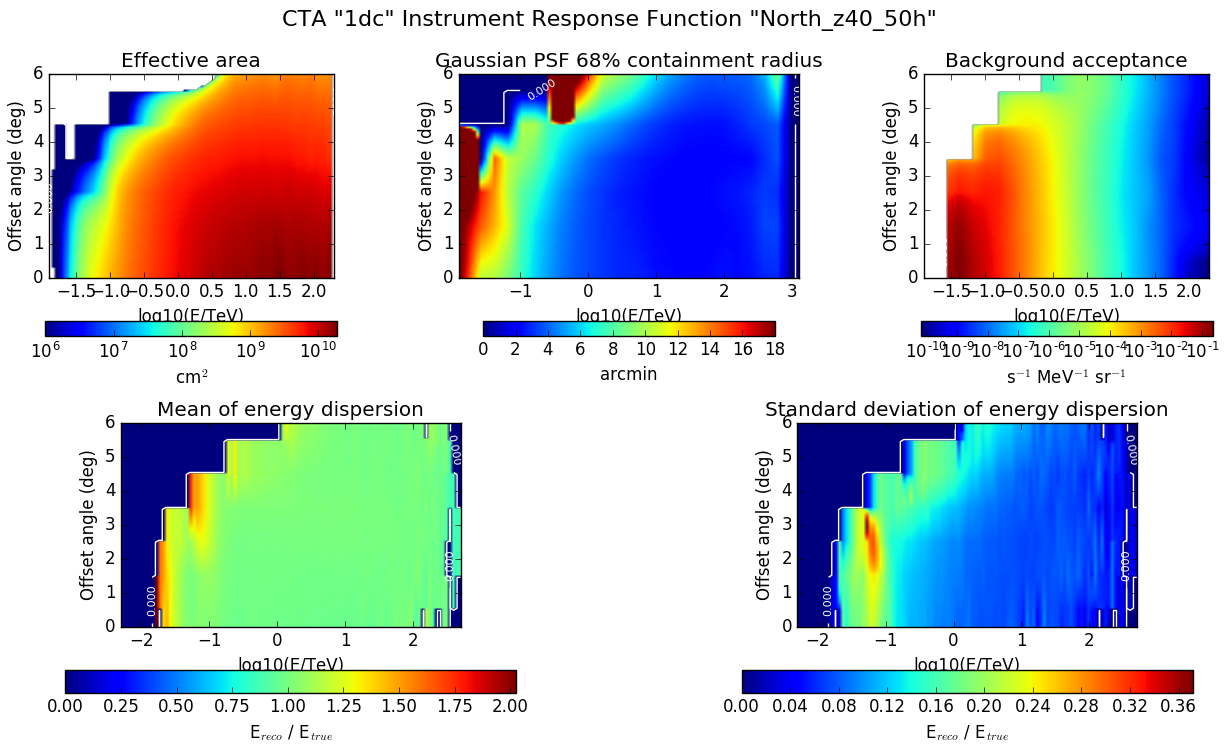
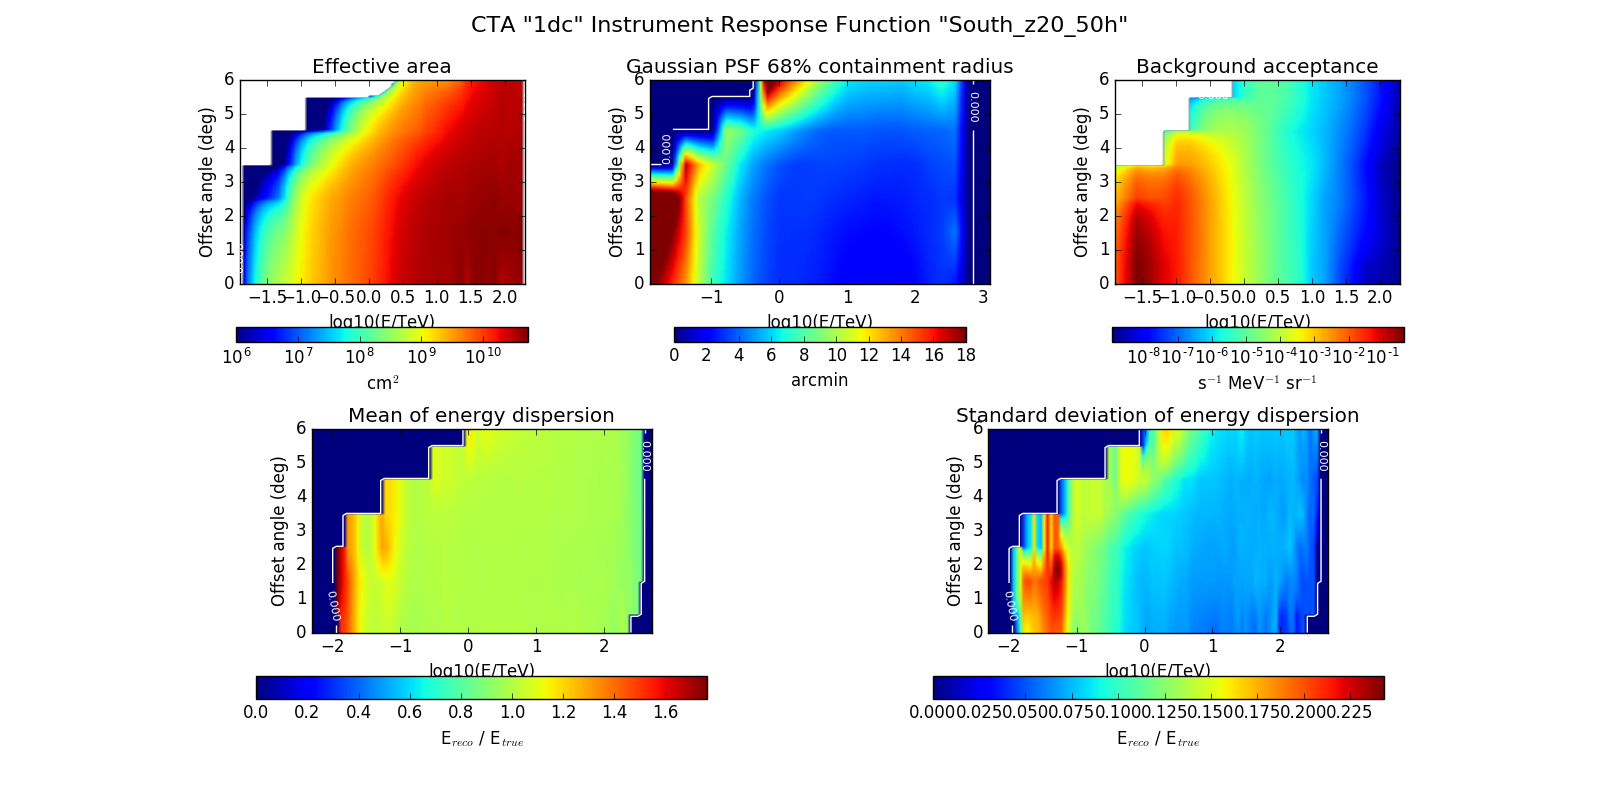
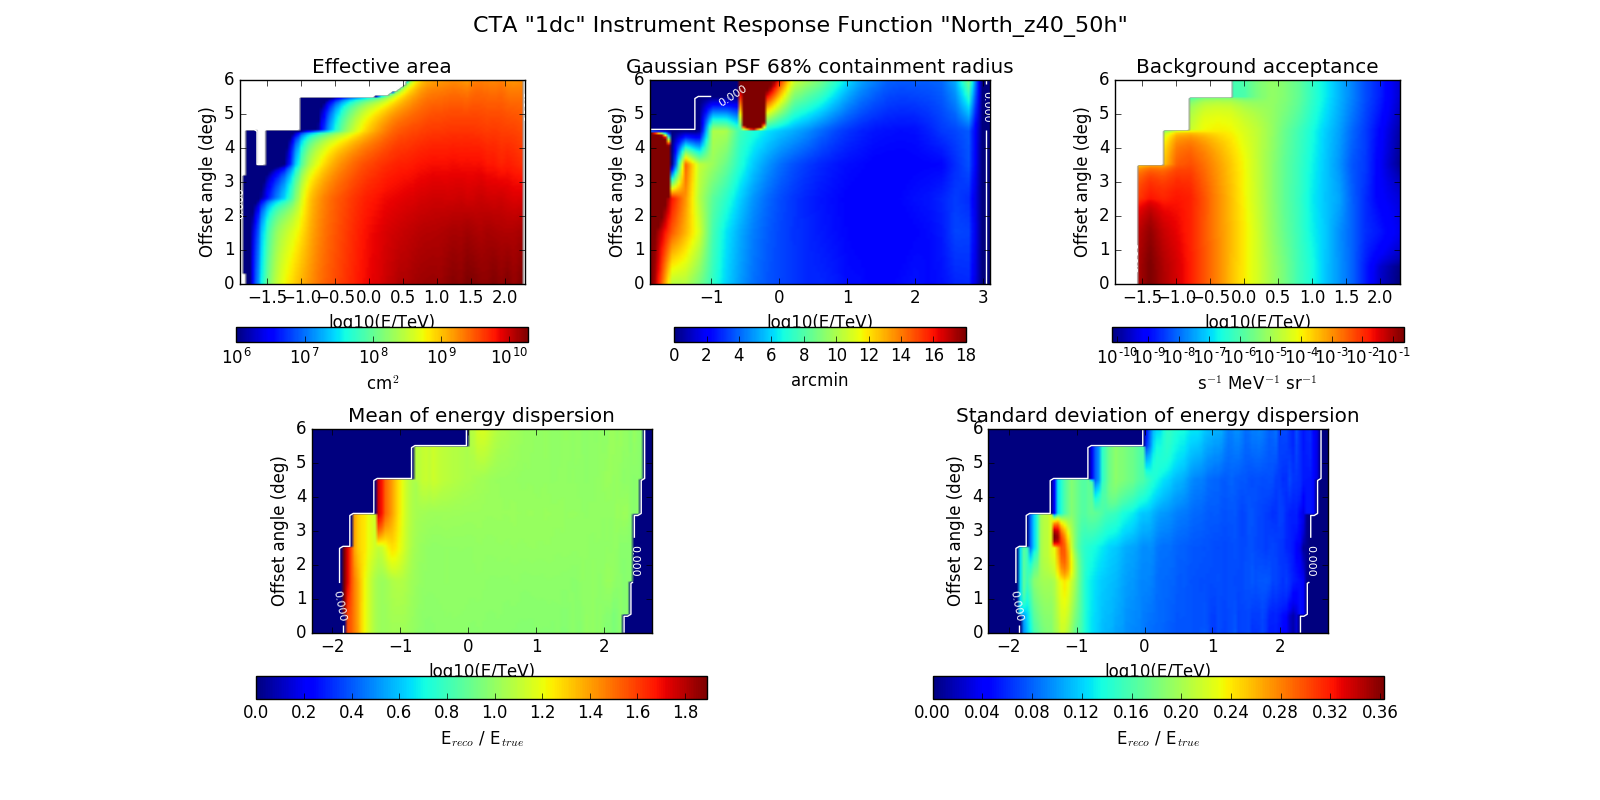
Here the IRF plots for the clipped and smooth energy dispersion:
| Original | Clipped and smoothed |
| |
 |
| |
 |
| |
 |
| |
 |
#6
Updated by Knödlseder Jürgen about 7 years ago
- File hess_specres_3D_edisp_clipping_smoothing.png added
- File hess_specres_3D_edisp.png added
- File hess_specres_3D.png added
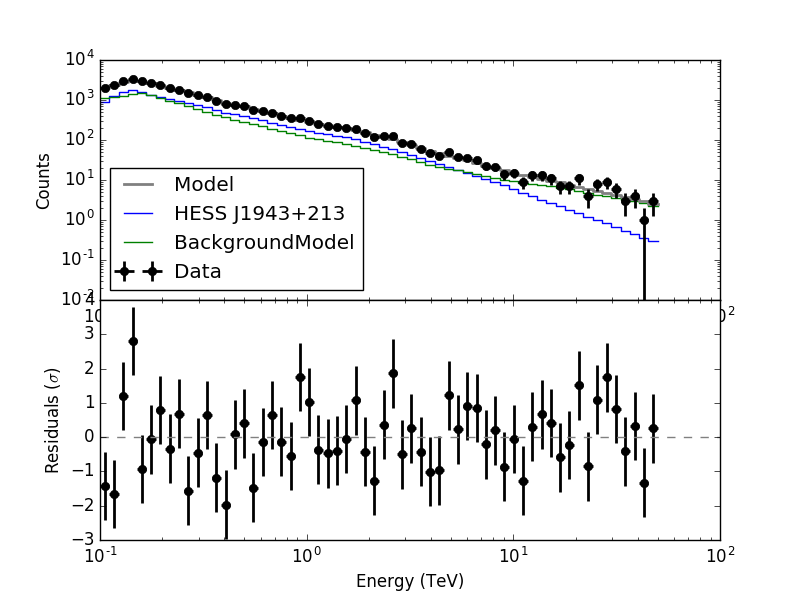
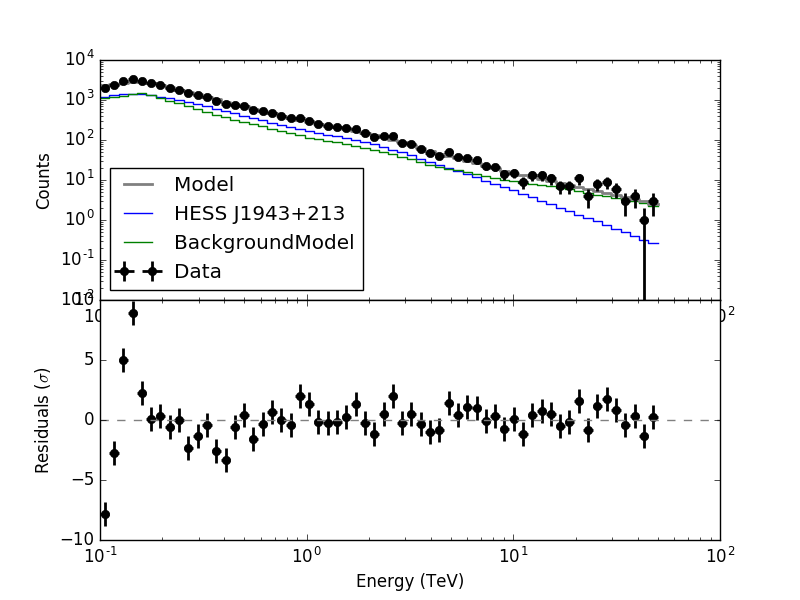
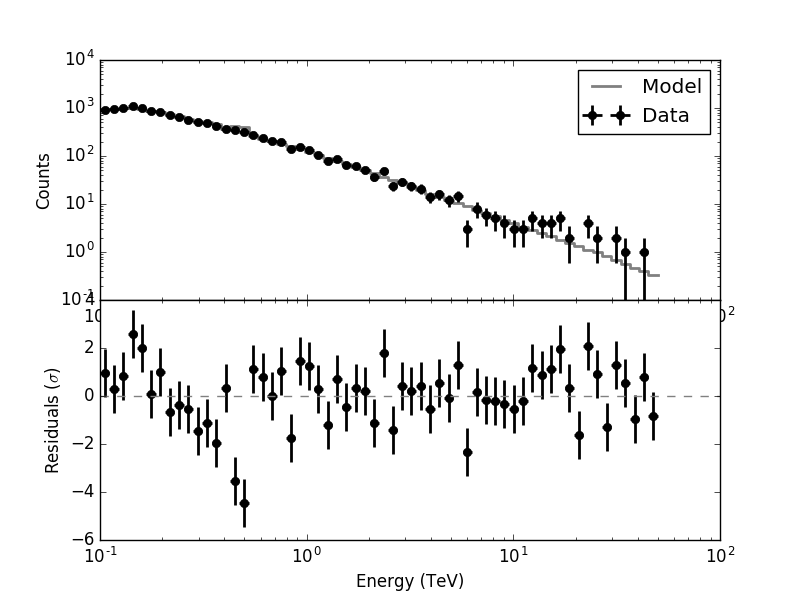
Here the results for HESS J1943+213 which mixes observations with South_z40_50h and North_z20_50h.
No Edisp  |
Edisp 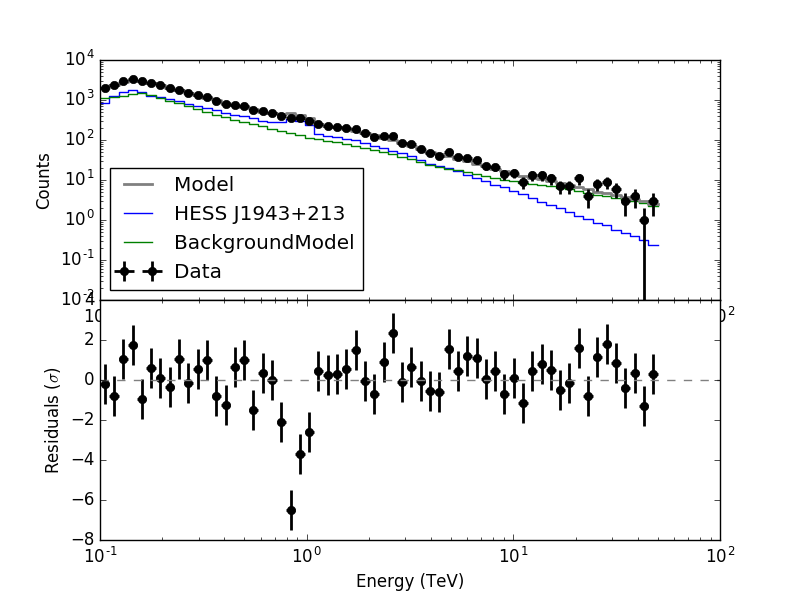 |
Clipped and smoothed Edisp  |
Without energy dispersion there are substantial residuals, with the raw energy dispersion matrix there is an important feature near 1 TeV, and with the clipped and smooth energy dispersion everything looks good.
The only strange thing is that the Prefactor of the fitted source is too large:
| Prefactor | Index | |
| True | 5.6e-19 | -3.100 |
| No energy dispersion | 10.0e-19 | -3.139 |
| Raw energy dispersion | 10.39e-19 | -3.135 |
| Clipped and smoothed energy dispersion | 11.09e-19 | -3.117 |
Maybe the sky model is too simple and there are other sources in the field of view.
#7
Updated by Knödlseder Jürgen about 7 years ago
The reason for the discrepancy is that the source occurs twice in the GPS:
  <source name="HESS J1943+213" type="PointSource">
    <spectrum type="PowerLaw">
      <parameter name="Prefactor" value="56.000001727799" error="0" scale="1e-20" min="0" free="1" />
      <parameter name="Index" value="3.09999990463257" error="-0" scale="-1" min="-10" max="10" free="1" />
      <parameter name="PivotEnergy" value="1" scale="1000000" free="0" />
    </spectrum>
    <spatialModel type="PointSource">
      <parameter name="RA" value="295.979203700646" error="0" scale="1" free="1" />
      <parameter name="DEC" value="21.302224614766" error="0" scale="1" free="1" />
    </spatialModel>
  </source>
  <source name="TeV_J1943+2118" type="PointSource" tscalc="1">
    <spectrum type="PowerLaw">
      <parameter name="Prefactor" value="5.6" error="0" scale="1e-19" min="1e-07" max="1000" free="1" />
      <parameter name="Index" value="3.1" error="0" scale="-1" min="0" max="10" free="1" />
      <parameter name="Scale" value="1000000" scale="1" min="0" max="10000000" free="0" />
    </spectrum>
    <spatialModel type="SkyDirFunction">
      <parameter name="RA" value="295.979" error="0" scale="1" min="-360" max="360" free="1" />
      <parameter name="DEC" value="21.3022" error="0" scale="1" min="-90" max="90" free="1" />
    </spatialModel>
  </source>
The first source is in
model_galactic_bright.xml, the second in model_agn.xml.
This means that the model parameter comparison should read as follows:
| Prefactor | Index | |
| True | 11.2e-19 | -3.100 |
| No energy dispersion | 11.00e-19 ± 0.18e-19 | -3.139 ± 0.011 |
| Raw energy dispersion | 10.39e-19 ± 0.17e-19 | -3.135 ± 0.011 |
| Clipped and smoothed energy dispersion | 11.09e-19 ± 0.18e-19 | -3.117 ± 0.010 |
| Clipped and smoothed energy dispersion with IEM | 11.13e-19 ± 0.18e-19 | -3.112 ± 0.010 |
#8
Updated by Knödlseder Jürgen about 7 years ago
- Status changed from In Progress to Closed
- % Done changed from 50 to 100
Merged code in bugfix-1.5.1 and devel.
#9
Updated by Knödlseder Jürgen almost 7 years ago
- File energy-dispersion.pdf added
Here a presentation of the issue for the ctools call.