Action #3564
Add phase selection to GCOMSelection
| Status: | Closed | Start date: | 03/13/2021 | |
|---|---|---|---|---|
| Priority: | High | Due date: | ||
| Assigned To: | % Done: | 100% | ||
| Category: | - | |||
| Target version: | 2.0.0 | |||
| Duration: |
Description
A phase selection should be added to GCOMSelection so that DRI can be generate for the phase of a gamma-ray binary.
GCOMSelection should hold a GModelTemporalPhaseCurve object that allows the transformation of time into the phase of a gamma-ray binary. In addition a GPhases instance should be added that allows for a phase selection. If the GPhases instance is empty, no phase selection should be applied. A GCOMSelection argument should be added to GCOMDri::compute_drx() so that the phase selection is also taken into account for the DRX computation.
Recurrence
No recurrence.
History
#1
 Updated by Knödlseder Jürgen almost 4 years ago
- Status changed from New to In Progress
- % Done changed from 0 to 50
A phase selection was added yet the phase histogram of LS 5039 is not comparable to the one published by Collmar et al. (2004). I therefore investigated the timing of the COMPTEL module.
The conversion from COMPTEL TJD / ticks to GTime is done using the gammalib::com_time() method. This method assumes that COMPTEL times are given in UTC and that 8393:0 converts into 1991-05-17T00:00:00 UT (see COM-RP-UNH-DRG-037). Specifically
// Compute MJD
double mjd = double(tjd) + 40000.0;

// Set time and retrieve result in native seconds
GTime time;
time.mjd(mjd, "UTC");
double secs = time.secs();

// Add ticks and set time in native seconds
secs += double(tics) * 0.000125;

// Set time
time.secs(secs);
(see also http://www.helmutsteinle.de/MPE/TLC/tjd.html).
#2
 Updated by Knödlseder Jürgen almost 4 years ago
I furthermore checked that the phase computation in GCOMDri::use_superpacket works. To check the phase that is computed I added the explicit phase computation
double days = oad.tstart().jd() - 2451943.09;
double phase2 = days / 3.90603;
phase2 -= floor(phase2);
phase=0.229085 phase2=0.229085
phase=0.229134 phase2=0.229134
phase=0.229182 phase2=0.229182
phase=0.229231 phase2=0.229231
phase=0.229279 phase2=0.229279
phase=0.229328 phase2=0.229328
phase=0.229376 phase2=0.229376
phase=0.229425 phase2=0.229425
...
Hence also the phase computation is correct.
#3
 Updated by Knödlseder Jürgen almost 4 years ago
I finally checked whether the events are indeed comprised in the superpackets, since the phase selection is based on the superpackets. Below an example showing the superpacket interval and the events that are comprised within the interval. Also this seems to work as expected.
oad=20639 tstart=1991-05-19T21:56:26 tstop=1991-05-19T21:56:42
event=262298 1991-05-19T21:56:26
event=262299 1991-05-19T21:56:26
event=262300 1991-05-19T21:56:26
event=262301 1991-05-19T21:56:27
event=262302 1991-05-19T21:56:28
event=262303 1991-05-19T21:56:29
event=262304 1991-05-19T21:56:29
event=262305 1991-05-19T21:56:29
event=262306 1991-05-19T21:56:30
event=262307 1991-05-19T21:56:30
event=262308 1991-05-19T21:56:30
event=262309 1991-05-19T21:56:30
event=262310 1991-05-19T21:56:30
event=262311 1991-05-19T21:56:31
event=262312 1991-05-19T21:56:31
event=262313 1991-05-19T21:56:33
event=262314 1991-05-19T21:56:33
event=262315 1991-05-19T21:56:34
event=262316 1991-05-19T21:56:34
event=262317 1991-05-19T21:56:34
event=262318 1991-05-19T21:56:36
event=262319 1991-05-19T21:56:36
event=262320 1991-05-19T21:56:36
event=262321 1991-05-19T21:56:38
event=262322 1991-05-19T21:56:38
event=262323 1991-05-19T21:56:39
event=262324 1991-05-19T21:56:39
event=262325 1991-05-19T21:56:39
event=262326 1991-05-19T21:56:39
event=262327 1991-05-19T21:56:40
event=262328 1991-05-19T21:56:42
oad=20640 tstart=1991-05-19T21:56:42 tstop=1991-05-19T21:56:59
event=262329 1991-05-19T21:56:43
event=262330 1991-05-19T21:56:44
...
#4
 Updated by Knödlseder Jürgen almost 4 years ago
As a side note there are 691200000 tics in a day, which means that 8000 tics is one second or one tic is 0.000125 seconds.
#5
 Updated by Knödlseder Jürgen almost 4 years ago
- File LS5039_phase_10-30MeV.png added
- File LS5039_phase_Collmar.jpg added
- % Done changed from 50 to 80
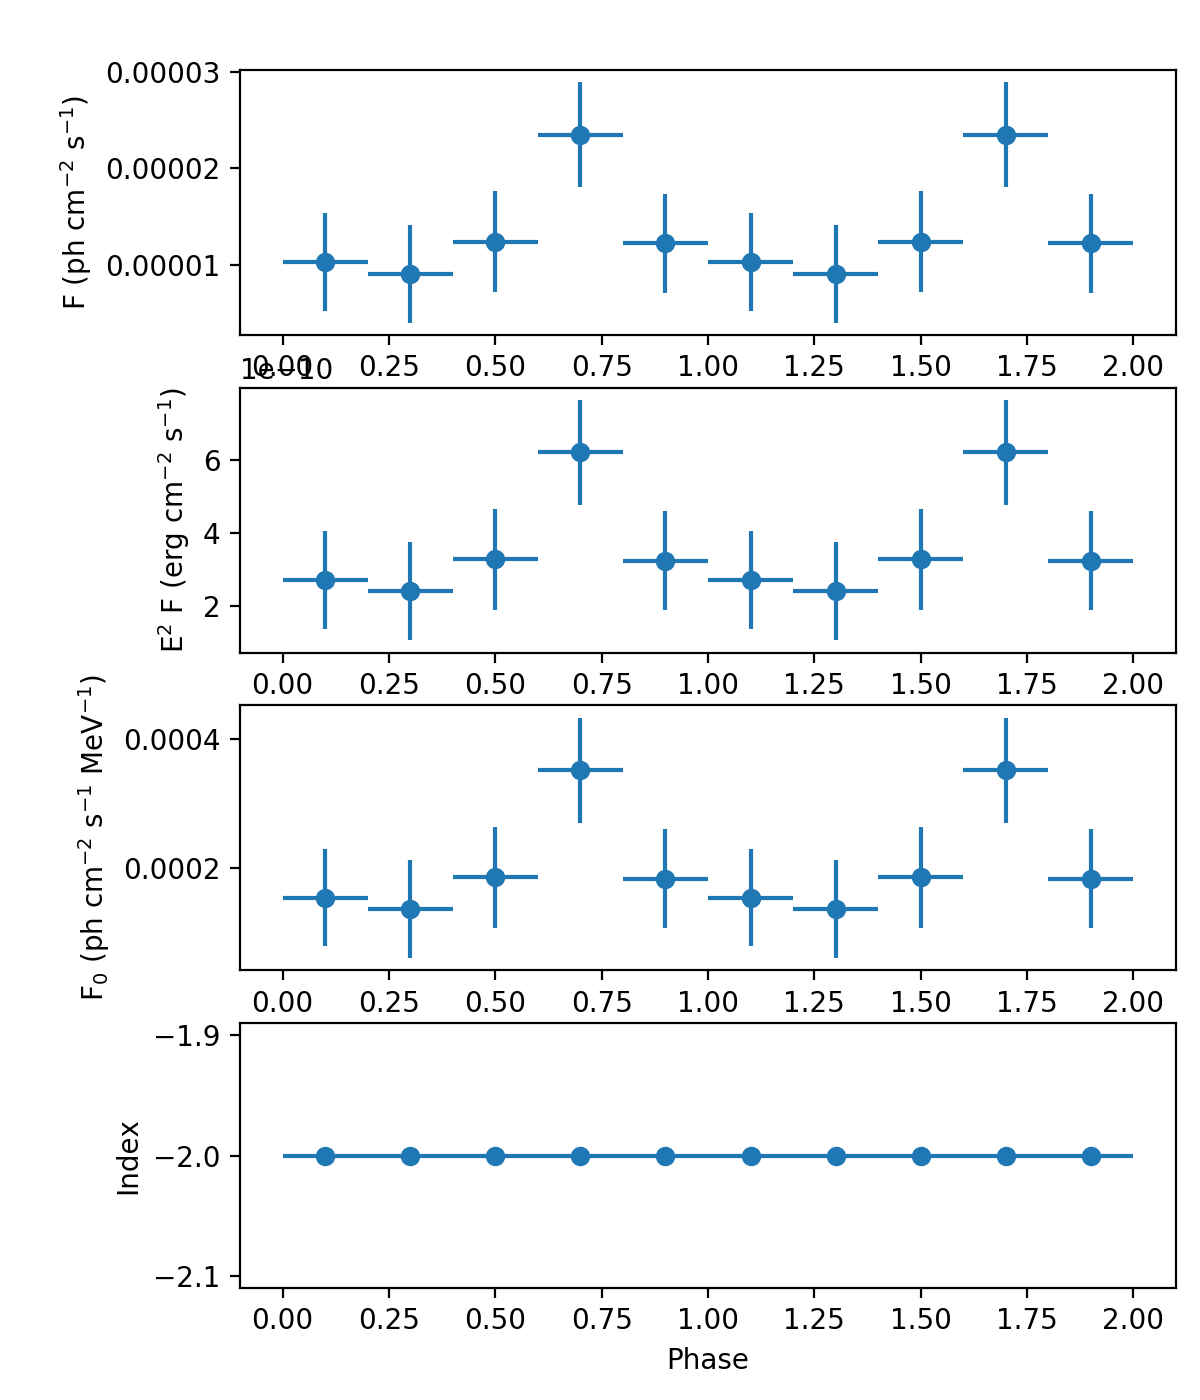
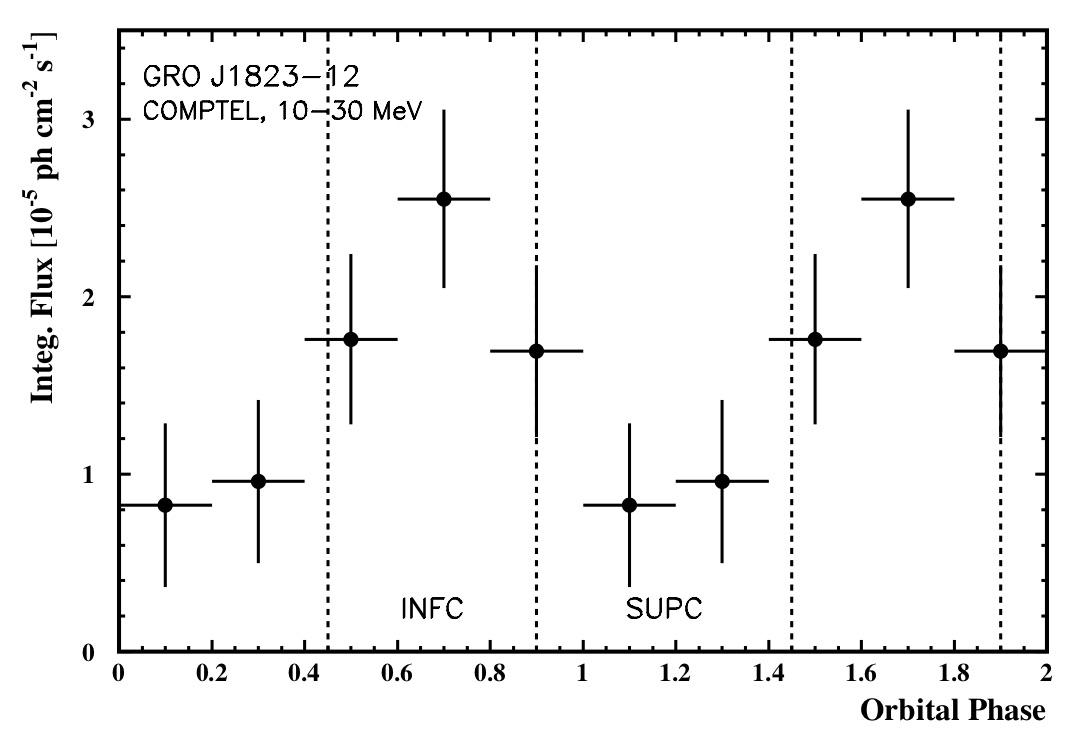
I did the analysis in the 10-30 MeV energy band only to compare with Figure 8 of Collmar et al. (2014). The result is shown in the left panel below, Figure 8 of Collmar et al. (2014) is reproduced on the right. The peak is now aligned with the peak found by Collmar et al. (2014). Also both points near the peak are a bit higher than the other 2 points, yet the increase is less pronounced as in Collmar et al. (2014). Note, however, that the data were only fitted with a Bremsstrahlungs model, while Collmar fitted Bremsstrahlung, Inverse Compton and isotropic background. One
 |
 |
#6
 Updated by Knödlseder Jürgen almost 4 years ago
- Status changed from In Progress to Closed
- % Done changed from 80 to 100
Code merged into devel.

