Feature #1051

create ctbutterfly or allow a access the covariance matrix via python
| Status: | Closed | Start date: | 01/03/2014 | |
|---|---|---|---|---|
| Priority: | Normal | Due date: | ||
| Assigned To: |  Mayer Michael Mayer Michael | % Done: | 100% | |
| Category: | - | |||
| Target version: | 00-08-00 | |||
| Duration: |
Description
In order to draw confidence regions of a spectral energy distribution, we should implement the functionality to calculate the butterfly of a fitted spectrum, taking into account the full covariance. Currently this is not possible since the covariance matrix cannot be accessed via the python interface (at least I did not find it).
Either we simply create a function to access the matrix, then the user can calculate the butterfly him- or herself directly in python, or, we implement a full ctool which computes the butterfly on its own. The latter would imply to also define a output format of the butterfly I guess.
Another possibility is to add a boolean parameter to ctlike which signals to calculate the butterfly after the fit using directly the optimised model. Again we would need a file format here.

Recurrence
No recurrence.
Related issues
History
#1
 Updated by Knödlseder Jürgen about 11 years ago
You may use
obs = GObservations()
...
(some optimization done here)
...
curvature = obs.function().curvature()
covar = curvature.invert()
from Python in the latest
devel branch. curvature is the curvature matrix that is computed in the maximum likelihood optimization, the invert() method is used to recover the covariance matrix. Possible, a factor 2 is missing in this example.
Let me know if this works for you ...
#2
Updated by Knödlseder Jürgen about 11 years ago
- % Done changed from 0 to 50
#3
Updated by Knödlseder Jürgen about 11 years ago
- Status changed from New to In Progress
#4
 Updated by Mayer Michael about 11 years ago
- % Done changed from 50 to 100
Excellent! That is all what is needed to compute butterflies. I wasn’t quite sure how to access GObservations::likelihood via python in the first place. But this seems the best way to do it. It gives the user great flexibility to access and work with the fit results.
#5
Updated by Knödlseder Jürgen over 10 years ago
- Target version set to 3rd coding sprint
What is the status of this tool? I know that David Sanchez is also interested in this and did some work during the 3rd coding sprint.
#6
Updated by Mayer Michael over 10 years ago
In the next days, I will upload a csscript doing the butterfly computations. Generally, since the computation is not very time-consuming, we might think about also putting that into ctlike?
The question remains how we want to store the output (ascii, fits, xml, ...)
#7
Updated by Knödlseder Jürgen over 10 years ago
Mayer Michael wrote:
In the next days, I will upload a csscript doing the butterfly computations. Generally, since the computation is not very time-consuming, we might think about also putting that into ctlike?
The question remains how we want to store the output (ascii, fits, xml, ...)
Great. One point that applies also to TS computation is that for the moment you get the information for all sources. If you deal with several tens of sources (for example in a survey) this may lead to huge computing times. So the question was whether one should be able to select for which sources the TS and/or butterfly computations are done. Should we just start will all sources, and eventually change the philosophy later? Or think immediate how the problem should be dealt with (a special tool or script? selection of the relevant sources in the XML file? other options?)
Concerning the format for butterfly, people were arguing that at this stage brute ASCII (or CSV) would be best.
#8
Updated by Mayer Michael over 10 years ago
- File csbutterfly.py
 added
added - File test_csbutterfly.py added
I attached a very preliminary version of the butterfly computation. So far, this tool only takes into account the correlation of the spectral parameters and not all parameter correlations. I still have to figure out how to combine the different scalings.
However, running the script test_ctbutterfly should work right away.
We should definitely aim to include that in ctlike, with steering flags or parameters, which sources should compute a TS or butterfly. This features should really be optional and not compromise the speed of the global fit.
I will be on vacations next week. Afterwards I could focus on implementing this feature in ctlike.
#9
Updated by Mayer Michael over 10 years ago
We could go for a similar feature as for the TS computation, i.e. just turn the butterfly computation on and off via the xml file, for each model individually. Since a butterfly specific to a spectrum, it might look like this in the xml file:
<?xml version="1.0" encoding="UTF-8" standalone="no"?>
<source_library title="source library">
  <source name="CrabNebula" type="PointSource" tscalc="1">
    <spectrum type="PowerLaw" bfcalc="1">
       <parameter name="Prefactor" scale="1.0e-17" value="1.0"  min="1e-10" max="1e6" free="1"/>
       <parameter name="Index"     scale="-1"    value="2.4" min="-5.0"   max="+5.0"   free="1"/>
       <parameter name="Scale"     scale="1e6"   value="1.0"  min="0.0001"  max="10000.0" free="0"/>
    </spectrum>
    <spatialModel type="SkyDirFunction">
      <parameter name="RA"  scale="1.0" value="83.6331" min="83" max="84" free="1"/>
      <parameter name="DEC" scale="1.0" value="22.0145" min="21"  max="23"  free="1"/>
    </spatialModel>
  </source>
</source_library>
Note the flag bfcalc in the spectrum definition. Maybe it should even be a filename instead of a boolean like
bfcal="butterfly.txt", which directly allows the user to specify the outfile for the butterfly. Of course, the outfile could also be named like model->name()+".txt". Any thoughts?#10
Updated by Knödlseder Jürgen over 10 years ago
I’m a little hesitant to add too much complexity to the XML file, but I don’t have really arguments, it’s just that I feel that things become a little too complicated. Somehow we are adding for every new computation a new parameter, while the ftool paradigm would be more to add a specific too for a new computation. On the other hand, having a specific tool to compute TS values and butterfly diagrams may be overkill. Having said this, there is maybe an important difference between TS computation and butterfly diagrams: when analysing data, you may often be interest in the TS values of the sources, while creating a butterfly diagram is somehow the last thing you do in an analysis before publishing the results (you may of course use this also during the analysis, but I guess one would rarely make butterfly diagrams for several sources in the field of view). If this is an acceptable argument, having TS computation in ctlike but the butterfly as a specific tool would make probably more sense. ctlike would stay a simple tool that is basically doing just one thing, while ctbutterfly would be an additional tool for a different and specific task. In that case, I would argue for just giving the source name and the result file as parameters to ctbutterfly should be fine.
#11
Updated by Mayer Michael over 10 years ago
A tool like
ctbutterfly would make use of the covariance matrix of the fit. This object is, however, not stored after an optimisation with ctlike. Accordingly, ctbutterfly would have to redo the analysis to access the covariance matrix (unless we pass the GObservations object from ctlike to ctbutterfly within a python script). In my opinion, we have two options:
- write
ctbutterfly, which reoptimises the models to get the covariance matrix - store the covariance matrix into a fits file on user’s request (e.g. a hidden parameter in
ctlike).
The first option seems more straight forward but might be more time consuming, while the second option saves time by introducing complexity.
#12
Updated by Knödlseder Jürgen over 10 years ago
I guess that in the long run we will have both options. I had planned since some time to add read() and write() methods to the matrix classes so that the matrix can be stored in a FITS file. This can then be used to store and read back the covariance matrix. In the meanwhile, we may just implement ctbutterfly with model re-optimization. In fact, if the parameters are already optimized it would be sufficient to call the error method as this also computes the covariance matrix. Even this is not really needed, the only thing that is needed is a call to GObservations::likelihood::value() which leads to the computation of the covariance matrix which then can be retrieved using a call to GObservations::likelihood::curvature().
#13
Updated by Mayer Michael over 10 years ago
- Status changed from In Progress to Feedback
A first version of ctbutterfly is available on branch 1051-create-ctbutterfly. The tool includes the (hidden) parameter 'matrix’, which is set to "NONE" on default. In case a filename is given here, an exception is thrown that the feature is not implemented.
The output ascii file is just a CSV table, which should be easy to use. However, since there is no GCsv::save method, the format is somewhat hard-coded in the ctbutterfly::save method. We might think about implementing GCsv::save() to simplify ctbutterfly::save.
Currently, ctbutterfly makes only use the correlation between the spectral parameters of the instances of GModelSky. I did not figure out how to incorporate the different scales of background models and sky models.ctbutterfly is also covered by a unit test.
#14
Updated by Knödlseder Jürgen over 10 years ago
- Assigned To set to Mayer Michael
I added the missing methods to the GCsv class (see #1342), adapted the code and merged ctbutterfly into the devel branch. There is still the issue with the matrix saving, I guess that’s maybe not so urgent.
#15
Updated by Knödlseder Jürgen over 10 years ago
- Target version changed from 3rd coding sprint to 00-08-00
Will close with next release unless I hear back from you.
Btw: we need to update also the documentation to describe the new tool.
#16
Updated by Mayer Michael over 10 years ago
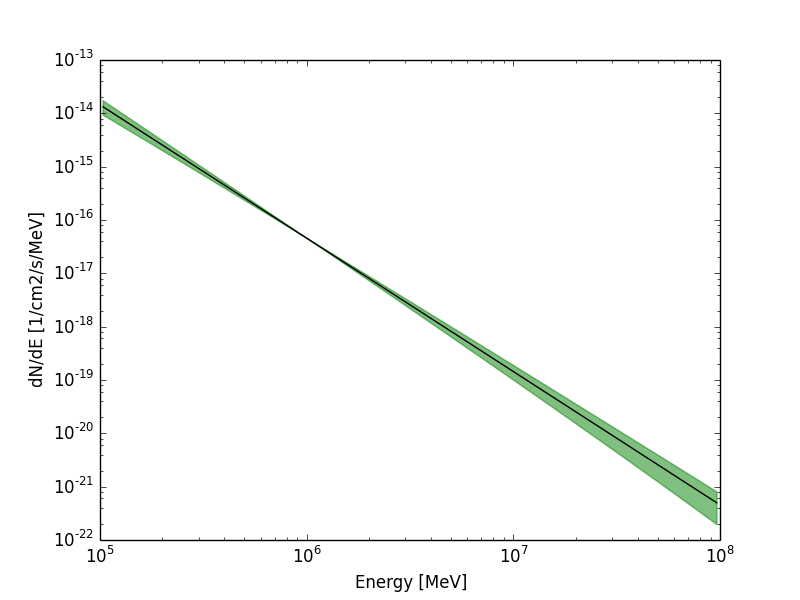
- File butterfly.png added
Ok, I guess the issue can be closed. ctbutterfly works fine for me. Analysing one crab run from the 1DC dataset and passing the result to ctbutterfly allows to plot the attached confidence band.
Btw: we need to update also the documentation to describe the new tool.
Where should the documentation be updated? I most certainly can write a few lines about the new tool.
#17
Updated by Knödlseder Jürgen over 10 years ago
Nice plot. Do you have a small script that uses matplotlib to generate the plot from the ASCII file? Something like show_butterfly.py? We could put this in the examples folder (or we may shift the show scripts to the script folder).
Concerning the documentation, everything is in doc/source which uses a rst-based format for the documentation. There are still some leftovers, such as the old html file describing the tools (they are in doc/source/fhelp. We want to port them to rst in the future, but for the time being you may just drop a ctbutterfly.html there in the same format as the other files. The file needs then to be linked into doc/source/tools_reference.rst.
You can see the resulting documentation on http://cta.irap.omp.eu/ctools/. The documentation gets automatically build after pushing into the devel branch, hence anything you add and that I integrate will show up there immediately (well, a couple of minutes after the push).
You may add some short information to the quick start guide (see the files in doc/source/user_manual/getting_started/quickstart.rst). We also have to think about a tutorial (see the related issue #1348).
#18
Updated by Mayer Michael over 10 years ago
I added an example script to plot the butterfly. I further added some documentation. All available on branch 1051-create-ctbutterfly. Since I’ve never written something there, I hope I did not introduce a break when compiling the documentation (at least make doc went fine on my system).
#19
Updated by Knödlseder Jürgen over 10 years ago
- Status changed from Feedback to Closed
Thanks, I merged the code and documentation into devel. I updated the documentation a little bit as the python command did not work (the path was not correct). I also added the show_butterfly.py script to the scripts that will get installed.
#20
Updated by Mayer Michael over 10 years ago
ok great, thanks!