Bug #1131

Results of ctmodel and ctobssim are not consistent
| Status: | Rejected | Start date: | 02/04/2014 | |
|---|---|---|---|---|
| Priority: | High | Due date: | ||
| Assigned To: | - | % Done: | 0% | |
| Category: | - | |||
| Target version: | - | |||
| Duration: |
Description
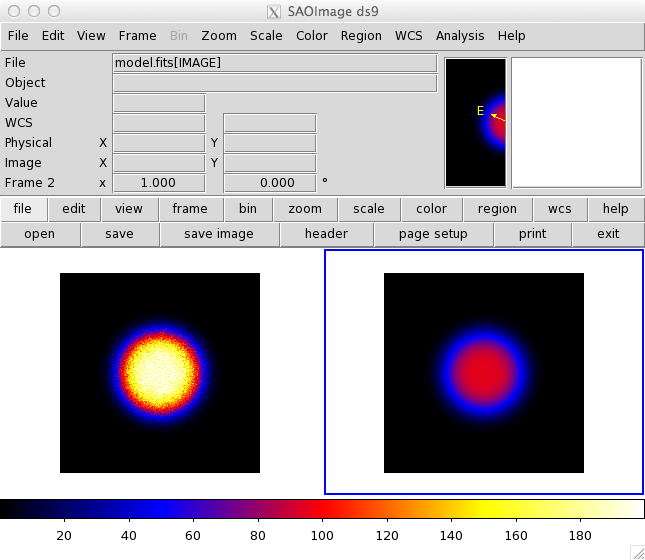
A count map made with ctobssim and ctbin is not consistent with a model map made with ctmodel. I will attach an input XML (model.xml), a count map (cmap.fits), a model map (model.fits), and a screen shot of DS9 comparing the two FITS images with the same color scale.
You can reproduce these maps with the following commands and parameters. I used GammaLib-00-08-00 and ctools-00-07-00 built with Clang on OS X Mavericks.
$ ctobssim
Model [model.xml]
Calibration database [$GAMMALIB/share/caldb/cta]
Instrument response function [kb_I_50h_v3]
RA of pointing (degrees) (0-360) [0]
Dec of pointing (degrees) (-90-90) [0]
Radius of FOV (degrees) (0-180) [5]
Start time (MET in s) (0) [0]
End time (MET in s) (0) [360000]
Lower energy limit (TeV) (0) [0.1]
Upper energy limit (TeV) (0) [100]
Output event data file or observation definition file [events.fits]
$ ctbin
Input event list or observation definition file [events.fits]
First coordinate of image center in degrees (RA or galactic l) [0]
Second coordinate of image center in degrees (DEC or galactic b) [0]
Algorithm for defining energy bins (FILE|LIN|LOG) [LOG]
Start value for first energy bin in TeV [0.1]
Stop value for last energy bin in TeV [100]
Number of energy bins [1]
Projection method e.g. AIT|AZP|CAR|MER|STG|TAN (AIT|AZP|CAR|MER|STG|TAN) [AIT]
Coordinate system (CEL - celestial, GAL - galactic) (CEL|GAL) [CEL]
Image scale (in degrees/pixel) [0.05]
Size of the X axis in pixels [200]
Size of the Y axis in pixels [200]
Output counts map or observation definition file [cmap.fits]
$ ctmodel
Input counts map or observation definition file [NONE]
Output counts map or observation definition file [model.fits]
Calibration database [$GAMMALIB/share/caldb/cta]
Instrument response function [kb_I_50h_v3]
Source model [model.xml]
RA of pointing (degrees) (0-360) [0]
Dec of pointing (degrees) (-90-90) [0]
Start time (MET in s) (0) [0]
End time (MET in s) (0) [360000]
Start value for first energy bin in TeV [0.1]
Stop value for last energy bin in TeV [100]
Number of energy bins [1]
Projection method e.g. AIT|AZP|CAR|MER|STG|TAN (AIT|AZP|CAR|MER|STG|TAN) [AIT]
Coordinate system (CEL - celestial, GAL - galactic) (CEL|GAL) [CEL]
First coordinate of image center in degrees (RA or galactic l) [0]
Second coordinate of image center in degrees (DEC or galactic b) [0]
Image scale (in degrees/pixel) [0.05]
Size of the X axis in pixels [200]
Size of the Y axis in pixels [200]
bkg_kb_I_50h_v3.txt  (629 Bytes)
cmap.fits (332 KB)
model.fits (332 KB)
model.xml
(494 Bytes)
Screen Shot 2014-02-04 at 21.18.56.png (78.9 KB)
analyse.py
(1.35 KB)
Recurrence
No recurrence.
Related issues
History
#1
 Updated by Okumura Akira almost 11 years ago
- File Screen Shot 2014-02-04 at 21.18.56.png added
#2
 Updated by Knödlseder Jürgen almost 11 years ago
I can understand the difference.
GammaLib evaluates a model always at the logarithmic centre of the bin. When you take a single large bin, the model does obviously not match the counts map. If you want to make a direct comparison you need to make a counts map with a finer binning and then sum over the energy axis. With increased number of binning, this should converge towards the correct solution.
#3
Updated by Knödlseder Jürgen almost 11 years ago
- File analyse.py added
Below the results for 1 bin, 20 bins and 40 bins (for the energy range 0.1-100 TeV). The last column gives the difference counts-model. With increasing energy binning, the result becomes more and more similar (I used the script analyse.py to produce the output). Even for 40 bins, the difference is still large, and it seems to come mainly from the second energy bin, i.e. a domain where the effective area changes quickly with energy. Note that this problem should not exist for unbinned analysis, as there all integrations over energy are done correctly:
0 914276.0 447131.944484 467144.055516
Total:  914276.0 447131.944484 467144.055516

cntmap_20.fits modmap_20.fits
0 481298.0 523798.685172 -42500.6851715
1 147909.0 133911.775382 13997.2246182
2 50777.0 50597.6584738 179.34152623
3 41017.0 40223.8350688 793.164931233
4 45495.0 48017.3128862 -2522.31288616
5 28669.0 28358.1777091 310.822290926
6 16279.0 16132.6185615 146.381438469
7 14243.0 12997.2570303 1245.74296972
8 30848.0 35582.4400766 -4734.44007661
9 12145.0 10993.4360548 1151.5639452
10 6590.0 6522.9034802 67.0965198021
11 8590.0 9190.13472778 -600.134727779
12 4515.0 4222.16115266 292.838847344
13 5679.0 5785.63487489 -106.634874889
14 5880.0 5918.40215838 -38.4021583778
15 3791.0 3839.16893364 -48.1689336398
16 3316.0 3285.36478175 30.6352182508
17 2618.0 2664.3084894 -46.308489397
18 2446.0 2460.26609098 -14.2660909806
19 2171.0 2348.17631039 -177.176310391
Total:  914276.0 946849.717414 -32573.7174143

cntmap_40.fits modmap_40.fits
0 260722.0 261224.558582 -502.558581957
1 220576.0 227501.828491 -6925.82849087
2 103044.0 100409.810426 2634.18957439
3 44865.0 44316.698888 548.301111962
4 27480.0 27241.0114288 238.988571222
5 23297.0 23320.8096552 -23.8096551577
6 20236.0 19964.7566095 271.243390503
7 20781.0 20944.2627062 -163.262706246
8 22858.0 22883.4902741 -25.4902740702
9 22637.0 23303.2268566 -666.226856591
10 16785.0 16691.405405 93.5945949568
11 11884.0 11955.5551731 -71.5551731109
12 9025.0 9017.43500807 7.56499193198
13 7254.0 7161.97373794 92.0262620618
14 5950.0 5688.29914239 261.700857614
15 8293.0 8328.19181565 -35.1918156464
16 13832.0 13779.7941182 52.2058818201
17 17016.0 18330.997971 -1314.99797097
18 8487.0 8191.93210512 295.067894884
19 3658.0 3660.88915187 -2.88915186759
20 2806.0 2819.94298683 -13.9429868257
21 3784.0 3744.10130239 39.8986976116
22 4796.0 4971.12694407 -175.126944068
23 3794.0 3769.01718013 24.9828198719
24 2582.0 2554.66866316 27.3313368418
25 1933.0 1931.52962417 1.47037583
26 2446.0 2522.1436052 -76.1436051998
27 3233.0 3293.35273229 -60.3527322851
28 3315.0 3330.92591207 -15.9259120656
29 2565.0 2609.45604478 -44.4560447769
30 2011.0 2044.25466954 -33.2546695373
31 1780.0 1839.4027157 -59.4027157031
32 1701.0 1701.570747 -0.570747004222
33 1615.0 1565.62825933 49.3717406698
34 1392.0 1402.34400091 -10.3440009071
35 1226.0 1256.0891675 -30.0891675023
36 1235.0 1207.03331315 27.9666868513
37 1211.0 1244.37397449 -33.3739744938
38 1215.0 1282.86980279 -67.8698027879
39 956.0 1010.71214415 -54.7121441509
Total:  914276.0 920017.471335 -5741.47133478
#4
Updated by Okumura Akira almost 11 years ago
Thank you Jürgen. Now I see the “mistake” made by me, and the limitation of ctmodel. It will be very nice if users can read this sort of caveats in ctools’ documentation in the future. Subtracting a background model from a count map is quite important in some cases.
#5
Updated by Okumura Akira almost 11 years ago
I used your analyse.py to check how finer bins I had to use. I tried nbins=100, 200, 300, 400, and 1000.
nbins = 20
Total:  914276.0 946849.717414 -32573.7174143

nbins = 40
Total:  914276.0 920017.471335 -5741.47133478

nbins=100
Total:  914276.0 916887.072042 -2611.07204213

nbins=200
Total:  914276.0 916342.979525 -2066.97952518

nbins=300
Total:  914276.0 915970.91784 -1694.91783975

nbins=400
Total:  914276.0 916168.261332 -1892.26133195

nbins=1000
Total:  914276.0 916124.203042 -1848.20304162
Comparing nbins = 400 and 1000, the model counts seem to be converging to ~1850. But for nbins=100, 200, and 300, the total model counts fluctuate.
Even if I use nbins of 1000, the difference between the count map and the model map is a bit large (-1848/916124**0.5 = -1.9). But it may be just a statistical fluctuation.
#6
Updated by Knödlseder Jürgen almost 11 years ago
Fully agree, this needs to be made clear in the documentation of ctmodel.
I’m also considering moving to computing for the bin edges and not the bin centre, but this needs probably some restructuring of the code in gammalib. Another option would be to add an explicit energy integration to ctmodel, which would probably be time consuming, but if handled as an option, it should still be okay.
Concerning statistical fluctuations, what I’m typically doing is pull distributions, see for example https://cta-redmine.irap.omp.eu/projects/gammalib/wiki/GModelSpectralPlaw. I also did this for the diffuse model, but the source I used was much stronger. It may be worth doing this for your case. I use the script cspull for this.
#7
Updated by Knödlseder Jürgen almost 11 years ago
- Status changed from New to Rejected
As this is not really a bug but a feature, I reject this one, but I created issue #1136 that requests adding a flag to ctmodel that enables energy integration internally. This should then solve this issue.