Bug #1819

pull distribution biased - related to new weighting method?
| Status: | Closed | Start date: | 07/19/2016 | |
|---|---|---|---|---|
| Priority: | Urgent | Due date: | ||
| Assigned To: |  Knödlseder Jürgen Knödlseder Jürgen | % Done: | 100% | |
| Category: | - | |||
| Target version: | 1.2.0 | |||
| Duration: |
Description
Hi,
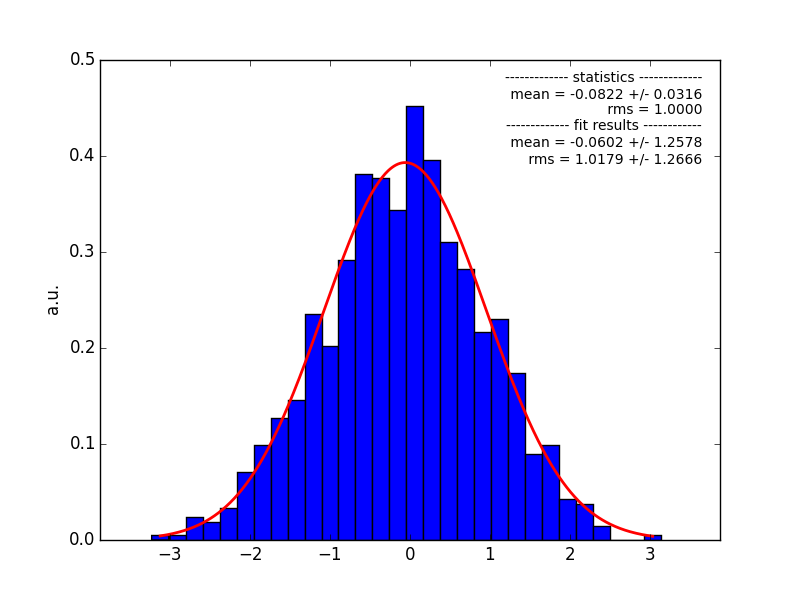
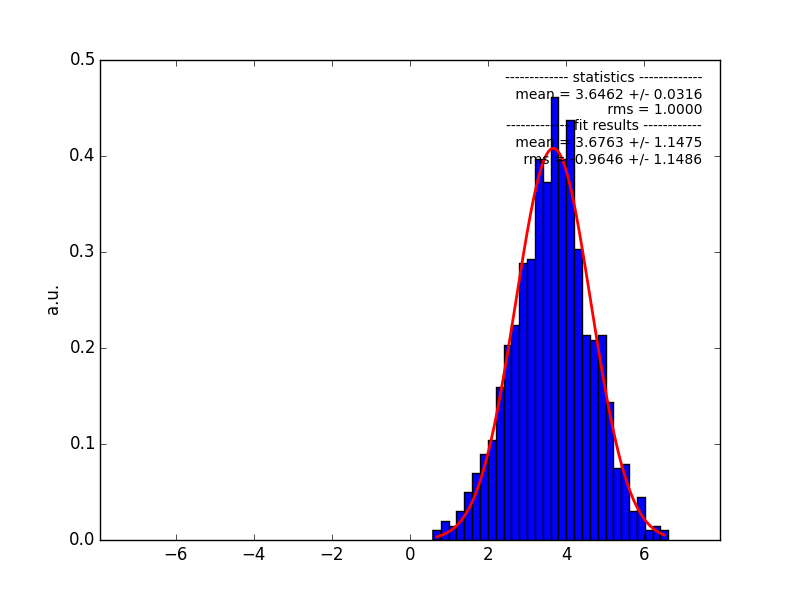
I observe a severe bias in the pull distribution of the spectral Index of a source - after updating to the software version when the weighting method for the counts cube was implemented.
I also have the distribution before updating to it, both shown below (generated from 1000 simulation runs, upper panel: before update, bottom: after update).
I do not know if there have been any other major update since my last software update that could also have an strong influence, but I think the most important change is the change in the filling of the counts cube.
Has someone else tried a binned analysis on a soft spectrum source since that update?
I also observe changes in another test analysis with the results that the spectral index of the source changes strongly, not compatible with the result before. The total number of events in the counts cube changes here by about 20% between the different methods how the counts cube is filled.


screenshot_3_1468911393_pull_before.png (37.2 KB)
screenshot_4_1468911404_pull_after.png (34.3 KB)
gammalib_tn0002_roi_stacked.pdf
(109 KB)

pull_index_edisp.png (39 KB)
Recurrence
No recurrence.
History
#1
 Updated by Knödlseder Jürgen over 8 years ago
- Assigned To set to Knödlseder Jürgen
- Priority changed from Normal to Urgent
- Target version set to 1.1.0
Can you post the configuration that you used (script, XML file) so that I can reproduce the problem?
#2
 Updated by Ziegler Alexander over 8 years ago
Well, it’s not too easy as it is part of a (somewhat bigger) analysis verification procedure I apply to an entire FoV.
I analyse several sources which are located inside the FoV and via running the simulations I want to verify that the procedure I use yields correct estimators for the source parameters of all the different sources. So it is not just standard generation of pull distributions of a single source. But nevertheless, before the update everything looked fine.
I was also thinking about how to reproduce this for a simpler FoV - until now I have not found time to test this (or lets say to produce the pull distributions for a single source), but as I said above, I also observed clearly strong changes in a short test analysis on a single source.
The standard settings I am always using are ten bins per decade, apart from that, as we have already discussed in other topics I use the save energy threshold from the effective area files for data selection. For the results above, I used furthermore E>500 GeV for data selection, and I have in total 22 energy bins.
An important question is, I think, when the weights are calculated, is the effective area taken into account? I do not understand how this works in detail, but I think that the number of counts has to be corrected somehow? For this correction (to calculate the number which would be expected in the entire bin), the information for the effective are needs to be accessed for the entire energy range of the bin, which means that the effective area information below the save energy threshold needs to be accessed?
Is that correct, or is this weighting done in a somehow different way?
#3
Updated by Knödlseder Jürgen over 8 years ago
You can see how the weighting works in the ctbin::fill_cube method. The weight is a product of RoI weight, energy weight and livetime (it’s in fact the relative livetime with respect to the total, since in ctbin::run the weights are divided by the total livetime).
From what you say the problem is probably with the energy weights, computed in ctbin::set_energy_weights. This method computes the overlap of the event list energy boundaries (as extracted from the DSS keywords) and the counts cube energy boundaries. The method assumes that the spectral distribution of the events within the bin follows a power law with index -2, which is an approximation. You mention soft sources, how soft are their spectral indices?
The problem with the approximation is that different events will have different spectral distributions (sources, background), and even taking the effective area would not be correct for background events (which should be dominant at low energies). If you comment
//#define G_PLAW_WEIGHTS
in
ctbin you replace the power law weighting by a simple overlap computation, and you can see the effect on the results.
I do not take any provision for save energy thresholds, I assume that this is done by ctselect before. Is this the way how you prepare your data?
#4
Updated by Ziegler Alexander over 8 years ago
Thanks for pointing out the important code pieces, I had a short look at them.
I do not take any provision for save energy thresholds, I assume that this is done by ctselect before. Is this the way how you prepare your data?
Yes, exactly, I use ctselect with option usethres=DEFAULT. I just thought that the problem might also be connected to a problematic query of the effective area below the threshold energy, in order to compute the correct weights. This is not done at the moment, and, as you already commented, would for background events not be correct.
You mention soft sources, how soft are their spectral indices?
For the source for which I generated the distributions above, index is about 2.4. To give an absolute number, the observed bias is about 0.1 - but this is nevertheless a strong change compared to the spread, as seen in the pull distribution (and the bias was not there before).
For the other quick test analysis on a single source, I chose a source with index about 3.4, which was then shifted to ~3.7 using the updated software.
From what you say the problem is probably with the energy weights, computed in ctbin::set_energy_weights
This is also my first guess, that the assumption of fixed spectral index 2 is the problem. But I am also not sure if the effective area might become important or not, to get correct weights for source counts. I think it should in principle be taken into account, and we are in a range (threshold regime) where there might be rapid changes - but to be honest I really have no feeling about the question if this can get critical or not.
And moreover, all these effects might also be strongly dependent on the data set used for analysis.
#5
Updated by Knödlseder Jürgen over 8 years ago
Ziegler Alexander wrote:
Thanks for pointing out the important code pieces, I had a short look at them.
I do not take any provision for save energy thresholds, I assume that this is done by ctselect before. Is this the way how you prepare your data?
Yes, exactly, I use ctselect with option usethres=DEFAULT. I just thought that the problem might also be connected to a problematic query of the effective area below the threshold energy, in order to compute the correct weights. This is not done at the moment, and, as you already commented, would for background events not be correct.
You mention soft sources, how soft are their spectral indices?
For the source for which I generated the distributions above, index is about 2.4. To give an absolute number, the observed bias is about 0.1 - but this is nevertheless a strong change compared to the spread, as seen in the pull distribution (and the bias was not there before).
For the other quick test analysis on a single source, I chose a source with index about 3.4, which was then shifted to ~3.7 using the updated software.From what you say the problem is probably with the energy weights, computed in ctbin::set_energy_weights
This is also my first guess, that the assumption of fixed spectral index 2 is the problem. But I am also not sure if the effective area might become important or not, to get correct weights for source counts. I think it should in principle be taken into account, and we are in a range (threshold regime) where there might be rapid changes - but to be honest I really have no feeling about the question if this can get critical or not.
And moreover, all these effects might also be strongly dependent on the data set used for analysis.
In the code before we simply excluded the entire bin, which thus avoided the problem of partially filled bins. We can always do the same tricky in ctbin (adding for example a flag that instructs ctbin to exclude partial bins), yet I’m a bit surprised that the effect you describe is so big. I will try to reproduce the problem so that I can investigate it.
#6
Updated by Ziegler Alexander over 8 years ago
We can always do the same tricky in ctbin (adding for example a flag that instructs ctbin to exclude partial bins)
I think such a flag would be a good option - it would always allow an analysis without additional assumptions which need to be done for filling partially covered bins.
However, I also understand the idea of using partially filled bins for analysis as it simply increases statistics. I think the main issue is pointed out in our discussion - the question is how strong the results depend on approximations applied within this procedure. I observe differences as described above. These should be easily reproducable if the problem is related to the weights (the way they are computed), if it is related to effective area corrections, it could get more difficult.
#7
Updated by Knödlseder Jürgen over 8 years ago
- Status changed from New to In Progress
- % Done changed from 0 to 10
- I am able to reproduce the problem using a test script with two stacked observations.
- The problem does not occur for a single binned observation
This hints towards a problem in the stacked response and not the bin weighting. I will continue the investigations.
#8
 Updated by Mayer Michael over 8 years ago
Thanks for investigating this. It might probably be good to add a test case (in particular for science verification) for stacked observations with different energy boundaries.
#9
Updated by Knödlseder Jürgen over 8 years ago
- % Done changed from 10 to 20
Mayer Michael wrote:
Thanks for investigating this. It might probably be good to add a test case (in particular for science verification) for stacked observations with different energy boundaries.
Agree that test cases should also be added for stacked analysis. However, the science verification step is already quite long, and adding more tests to it will make it even longer, but again, I agree that this needs to be done.
Here a summary for where I stand:- a single stacked observation using the response cube gives the same good results than a single binned observation using the IRFs
- two stacked observations offset by +/-1° result in a bias of the pull distribution, noticeable in the fitted source but very significantly in the fitted background model
- changing from power law to linear overlap computation did not improve things (results are basically the same)
- using the same energy threshold for both observations did not improve things (results are basically the same)
- aligning the energy threshold on the counts cube boundaries did not improve things (results are basically the same)
- however, using the same pointing direction for both observations (but different energy thresholds) did improve things (results are basically unbiased)
The last two tests show that the problem is related to different pointings and not the computation of the fractional bin overlaps.
#10
Updated by Ziegler Alexander over 8 years ago
The last two tests show that the problem is related to different pointings and not the computation of the fractional bin overlaps.
This means then pointings and somehow their connection to the weighting method? Because I observed no bias before the update and the distributions I generated used also runs with different pointings. This means there is a problem in the spatial weights (roi_weights)?
I think the problem for different pointings should be gone when you run a test with a downgraded version not using the weighting method at all.
#11
Updated by Knödlseder Jürgen over 8 years ago
- File gammalib_tn0002_roi_stacked.pdf added
- % Done changed from 20 to 50
I looked a bit in the mathematics of the weighting, which I should have done before implementing the weighting scheme . The preliminary conclusion is that the actual scheme is not correct, and there seems to be no straight forward way to implement this properly. I wrote things up in a GammaLib tech note (see gammalib_tn0002_roi_stacked.pdf).
Would be nice if you could look into the tech note to check if I missed some obvious thing.
This probably means that we have to revert to the original scheme (as you proposed ), with the obvious limitations about PSF spill over and energy redistribution.
What I liked with the weighting scheme was the fact that you do not need to worry about spatial or spectral coverage of the counts cube (in other words: you could have an RoI smaller than the counts cube with unfilled regions in the counts cube). In Fermi/LAT this is not implemented, and many people made the mistake of not choosing an RoI that is larger than the counts cube. We still may think to keep this feature, as it prevents people from making mistakes. Still, it’s not clear to me how to deal with partial overlaps, but we may make simply an assumption here.
#12
Updated by Ziegler Alexander over 8 years ago
I will have a look at the file.
What I liked with the weighting scheme was the fact that you do not need to worry about spatial or spectral coverage of the counts cube (in other words: you could have an RoI smaller than the counts cube with unfilled regions in the counts cube).
Are unfilled regions in the counts cube a problem for ctools analysis with the old scheme? I thought this should just be corrected by setting the exposure correctly in the exposure cube (that means simply to zero if the ROI is smaller than the cube region for corresponding bins)?
On http://cta.irap.omp.eu/ctools-devel/user_manual/iact_analysis/analysis.html#stacked-binned-analysis, there is written
Note that bins only get filled if the bin of the cube is fully contained in the energy range and RoI of a considered observation.
This made me think that if there are bins in the cube which are not contained in the RoI, the exposure is just set to zero, so that for this corresponding observation, there is no contribution when calculating an averaged exposure for the bin (or in case of only one observation, it just doesn’t matter at all). So to make my point clear, I thought that this is in ctools also with the old scheme not a problem (apart from partial coverage of bins).
#13
Updated by Knödlseder Jürgen over 8 years ago
Ziegler Alexander wrote:
I will have a look at the file.
What I liked with the weighting scheme was the fact that you do not need to worry about spatial or spectral coverage of the counts cube (in other words: you could have an RoI smaller than the counts cube with unfilled regions in the counts cube).
Are unfilled regions in the counts cube a problem for ctools analysis with the old scheme? I thought this should just be corrected by setting the exposure correctly in the exposure cube (that means simply to zero if the ROI is smaller than the cube region for corresponding bins)?
Exposure is defined in physics space, the counts cube in data space. Unfilled regions are a problem, because 0 events is an information, so the code has to know which bins are zero because they are excluded from the filling and which bins are zero because the instrument did not measure an event.
On http://cta.irap.omp.eu/ctools-devel/user_manual/iact_analysis/analysis.html#stacked-binned-analysis, there is written
Note that bins only get filled if the bin of the cube is fully contained in the energy range and RoI of a considered observation.
This made me think that if there are bins in the cube which are not contained in the RoI, the exposure is just set to zero, so that for this corresponding observation, there is no contribution when calculating an averaged exposure for the bin (or in case of only one observation, it just doesn’t matter at all). So to make my point clear, I thought that this is in ctools also with the old scheme not a problem (apart from partial coverage of bins).
In the past we did indeed limit the effective area to the RoI, but formally this is not correct because they do not live in the same space. If you have for example a strong source just outside the RoI, it will contribute events due to PSF blurring, but by setting the exposure to zero these events will not be modeled.
The same thing happens in energy space when you want to take energy dispersion into account.
#14
Updated by Ziegler Alexander over 8 years ago
In the past we did indeed limit the effective area to the RoI, but formally this is not correct because they do not live in the same space. If you have for example a strong source just outside the RoI, it will contribute events due to PSF blurring, but by setting the exposure to zero these events will not be modeled.
The same thing happens in energy space when you want to take energy dispersion into account.
I understand that point now (thanks for this nice example) - and to be honest I was somehow not aware of this problem. I think this is a quiet general problem for the analysis of IACT data, because you will always want to combine as much data as possible, which means e.g. using observations with different pointings. Even if you take observations taken on one specific source, typically these are all done using wobble offsets of about 0.5 deg in different directions. Regarding the problems above, this might already reduce considerably the size/ position of a possible FoV to analyze it correctly. Or is this assumption wrong?
I red your technical node - it illustrates the problem very nicely. I only have one basic problem in the understanding: why is there the need for the computation of the weighting function of the stacked observation. If you want to fit a model to data, you can stack the data of different observations, and you basically need to know how to compute the expected number of events in the stacked cube, what could be done only with Equ. 2.
#15
Updated by Knödlseder Jürgen over 8 years ago
Ziegler Alexander wrote:
In the past we did indeed limit the effective area to the RoI, but formally this is not correct because they do not live in the same space. If you have for example a strong source just outside the RoI, it will contribute events due to PSF blurring, but by setting the exposure to zero these events will not be modeled.
The same thing happens in energy space when you want to take energy dispersion into account.
I understand that point now (thanks for this nice example) - and to be honest I was somehow not aware of this problem. I think this is a quiet general problem for the analysis of IACT data, because you will always want to combine as much data as possible, which means e.g. using observations with different pointings. Even if you take observations taken on one specific source, typically these are all done using wobble offsets of about 0.5 deg in different directions. Regarding the problems above, this might already reduce considerably the size/ position of a possible FoV to analyze it correctly. Or is this assumption wrong?
I don’t think that this really reduces the FoV to analyze. You just have to be aware of the pitfalls. When you know that there is strong source nearby, you can exclude this part of the data space.
By the way, this is another reason I want to keep the weighting array: it provides quite some flexibility, and provision for more fancy analysis in the future. It also allows to exclude zones in the data space from the likelihood fitting (this was already possible before by setting counts cube bins to -1, but having a specific weight array for this is probably cleaner).
I red your technical node - it illustrates the problem very nicely. I only have one basic problem in the understanding: why is there the need for the computation of the weighting function of the stacked observation. If you want to fit a model to data, you can stack the data of different observations, and you basically need to know how to compute the expected number of events in the stacked cube, what could be done only with Equ. 2.
As soon as you have done one event selection (for example using only events above an energy threshold) you effectively make a RoI cut and hence you run into the problems described in the tech note. Only if you except all events without any cut, the w does not exist.
#16
Updated by Knödlseder Jürgen over 8 years ago
- Status changed from In Progress to Feedback
- % Done changed from 50 to 90
I have now “reverted” the code to the old method of cutting the effective area cube, PSF cube, energy dispersion cube and background cube in RoI, and of not using partially filled energy bins. “Reverted” means that I have not simply used the old code, but reimplemented it again with some improvements.
For example, all ctools used for response cube evaluation (ctexpcube, ctpsfcube, ctedispcube, and ctbkgcube) now have a hidden addbounds parameter that by default is set to yes. This parameter instructs the tools to insert a layer in the response cube at every energy boundary of the input event lists. In that way I hope that the computation of the response cube is more accurate.
There is now also a warning in ctexpcube and ctbkgcube that signals when the number of energy layers is too low. I made in fact a test case where I went down to 50 GeV, and it turned out that I need around 25 cube layers per energy decade to get accurate fits. So it’s probably wise to use always a large number of energy layers, at least in the exposure and background cubes.
I merged the code into devel so you can play around with it. Both GammaLib and ctools need to be updated. I put the status to “Feedback” to see whether the new code fixes the problem on your side.
I also need to check the energy dispersion cube, and finally, I should really add an example to the ctools science verification. Therefore keep the Done at 90%.
#17
Updated by Knödlseder Jürgen over 8 years ago
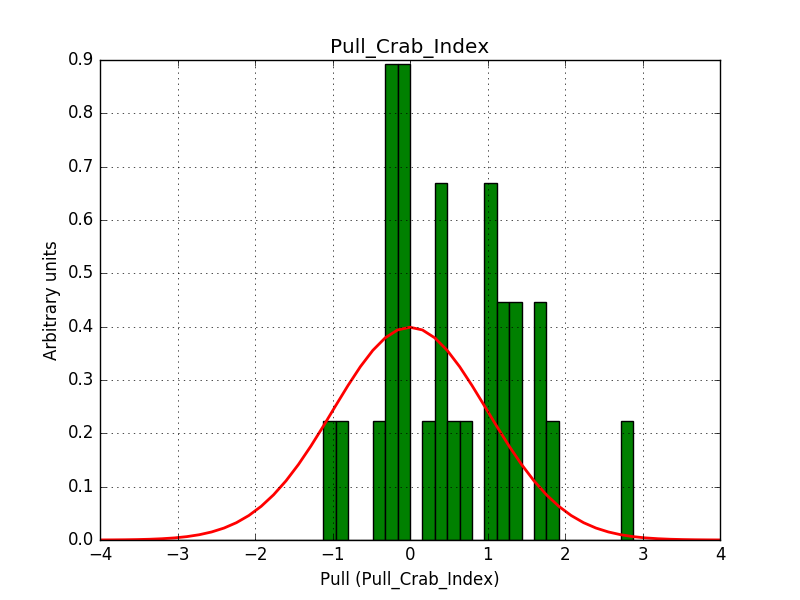
- File pull_index_edisp.png added
- % Done changed from 90 to 100
I did some initial checks on the energy dispersion, which shows a slight bias in the index (see below), but this may be related to the limitations of the method. Needs a bit of further investigations. Otherwise things look fine.
#18
Updated by Mayer Michael over 8 years ago
For example, all ctools used for response cube evaluation (ctexpcube, ctpsfcube, ctedispcube, and ctbkgcube) now have a hidden addbounds parameter that by default is set to yes. This parameter instructs the tools to insert a layer in the response cube at every energy boundary of the input event lists. In that way I hope that the computation of the response cube is more accurate.
I am not sure this is very handy. When we run a HESS analysis of e.g. 500 runs in the observation container, this would imply about 500 energy bins I guess (even more for PSF cube or Edisp cube). This would slow down the computation time a lot (and increase file sizes), wouldn’t it? Probably a maximum of energy bins should be introduced to safely ignore energy boundaries which are very similar.
Another thing that came to my mind was the following:
We could keep the weighting for the energy boundaries but simply remove it for the RoI. This would imply any bin that is only partly contained in the RoI would be ignored by all tools. As I understand correctly, this was were the problem originated, right?
However, I think we could keep the energy weighting (if it works of course). Actually, the addbounds parameter could then investigate minimum and maximum energy boundary of all event lists and then set the overall cube energy boundaries to that values in order to avoid completely empty bins. Specifying addbounds=yes (or call it obs_ebounds=yes) would imply there is no query for emin and emax anymore.
#19
Updated by Knödlseder Jürgen over 8 years ago
Mayer Michael wrote:
For example, all ctools used for response cube evaluation (ctexpcube, ctpsfcube, ctedispcube, and ctbkgcube) now have a hidden addbounds parameter that by default is set to yes. This parameter instructs the tools to insert a layer in the response cube at every energy boundary of the input event lists. In that way I hope that the computation of the response cube is more accurate.
I am not sure this is very handy. When we run a HESS analysis of e.g. 500 runs in the observation container, this would imply about 500 energy bins I guess (even more for PSF cube or Edisp cube). This would slow down the computation time a lot (and increase file sizes), wouldn’t it? Probably a maximum of energy bins should be introduced to safely ignore energy boundaries which are very similar.
There is an internal test for “similarity”, but the energy difference is very small. I agree that 500 additional layers would be overkill. How about setting the parameter by default to “no”?
Another thing that came to my mind was the following:
We could keep the weighting for the energy boundaries but simply remove it for the RoI. This would imply any bin that is only partly contained in the RoI would be ignored by all tools. As I understand correctly, this was were the problem originated, right?
However, I think we could keep the energy weighting (if it works of course). Actually, theaddboundsparameter could then investigate minimum and maximum energy boundary of all event lists and then set the overall cube energy boundaries to that values in order to avoid completely empty bins. Specifyingaddbounds=yes(or call itobs_ebounds=yes) would imply there is no query foreminandemaxanymore.
There is no fundamental difference between RoI and energy selection. Whenever you do an event selection (in whatever coordinate) you run into the mentioned problem. There is in fact a RoI and energy selection in all response cube tools. So I’m afraid we cannot do partially filled energy bins (unless we compute precisely the formulae outlined in the tech note, but then the weighting becomes model dependent, needing an iterative method to assure convergence).
#20
Updated by Mayer Michael over 8 years ago
How about setting the parameter by default to “no”?
Yes that sounds reasonable.
There is no fundamental difference between RoI and energy selection. Whenever you do an event selection (in whatever coordinate) you run into the mentioned problem. There is in fact a RoI and energy selection in all response cube tools. So I’m afraid we cannot do partially filled energy bins (unless we compute precisely the formulae outlined in the tech note, but then the weighting becomes model dependent, needing an iterative method to assure convergence).
I think the difference is that usually we use much more RoI bins than energy bins, i.e. using one RoI bin or not will not result in too much difference in counts while dropping an entire energy bin (in particular at low energies) will cause a significant reduction of statistics. But I understand the problem, thus I am in favour of perhaps creating another ctool, e.g. ctmkbins that creates a reasonable binning according to the input observation boundaries. I think we already discussed this sometime in the past. Certainly this is something for 1.2.0 (e.g. also the coding sprint in fall). For now and 1.1.0 we should revert back as you proposed with the addbounds parameter defaulting to “no”.
#21
Updated by Knödlseder Jürgen over 8 years ago
Mayer Michael wrote:
How about setting the parameter by default to “no”?
Yes that sounds reasonable.
Okay, will change that.
There is no fundamental difference between RoI and energy selection. Whenever you do an event selection (in whatever coordinate) you run into the mentioned problem. There is in fact a RoI and energy selection in all response cube tools. So I’m afraid we cannot do partially filled energy bins (unless we compute precisely the formulae outlined in the tech note, but then the weighting becomes model dependent, needing an iterative method to assure convergence).
I think the difference is that usually we use much more RoI bins than energy bins, i.e. using one RoI bin or not will not result in too much difference in counts while dropping an entire energy bin (in particular at low energies) will cause a significant reduction of statistics. But I understand the problem, thus I am in favour of perhaps creating another
ctool, e.g.ctmkbinsthat creates a reasonable binning according to the input observation boundaries. I think we already discussed this sometime in the past. Certainly this is something for 1.2.0 (e.g. also the coding sprint in fall). For now and 1.1.0 we should revert back as you proposed with theaddboundsparameter defaulting to “no”.
I see what you mean. A ctmkbins tool (or maybe script) sounds reasonable. We have the possibility provide input files to the tools, hence the script should generate them. What is critical is energy boundaries, but also the gradient in the effective area and background rates (to sample reasonably well the threshold). How about creating an issue? About names, we could name it csebinfile$ since @ebinfile is the name of our parameter?
#22
Updated by Knödlseder Jürgen over 8 years ago
- Target version changed from 1.1.0 to 1.2.0
Knödlseder Jürgen wrote:
Mayer Michael wrote:
How about setting the parameter by default to “no”?
Yes that sounds reasonable.
Okay, will change that.
Just recognised that I forgot this for release 1.1 Will do for the next release ...
#23
Updated by Mayer Michael over 8 years ago
Ok no worries. Do we plan a 1.1.1 release in case we encounter more bugs right away?
#24
Updated by Knödlseder Jürgen over 8 years ago
Mayer Michael wrote:
Ok no worries. Do we plan a 1.1.1 release in case we encounter more bugs right away?
In case any bugs are encountered we will indeed make bugfix releases (1.1.x).
This one is not a bug, but an unsatisfied change request Hence it won’t go in 1.1.x.
It’s however already done in 1.2.0.dev1 (devel branch).
#25
Updated by Mayer Michael over 8 years ago
ok great!
#26
Updated by Knödlseder Jürgen about 8 years ago
- Status changed from Feedback to Closed