Feature #1867
Tool to compute a residual significance map
| Status: | Closed | Start date: | 10/06/2016 | |
|---|---|---|---|---|
| Priority: | Normal | Due date: | ||
| Assigned To: | % Done: | 100% | ||
| Category: | - | Estimated time: | 6.00 hours | |
| Target version: | 1.3.0 | |||
| Duration: |
Description
We should explore the option to compute residual significance maps. Ideally we could implement something like the Li&Ma formula to derive a significance map. This kind of significance maps would allow to also see negative fluctuations in terms of significance.
Recurrence
No recurrence.
History
#1
 Updated by Knödlseder Jürgen almost 8 years ago
- Target version changed from 1.2.0 to 1.3.0
#2
 Updated by Di Venere Leonardo over 7 years ago
- Assigned To set to Di Venere Leonardo
- Estimated time set to 6.00
An additional method in gammalib “GSkyMap” to calculate the logarithm of a map is necessary.
#3
 Updated by Di Venere Leonardo over 7 years ago
- File equation1.PNG added
- File equation2.png added
- File resmap_SIGNIF_events_hist.png added
- File resmap_SIGNIF_events_image.png added
- File resmap_SUBDIVSQRT_events_hist.png added
- File resmap_SUBDIVSQRT_events_image.png added
- Status changed from New to Pull request
- % Done changed from 0 to 100
I’ve implemented the calculation of a residual significance map in csresmap.py, adding a new case algorithm case (called 'SIGNIF’).
The significance is calculated using the following formula:
where 'ci’ and 'mi’ are the data and model values in pixel i respectively.
For pixels with 0 counts (ci=0), the significance is estimated as:

This formula can be derived applying the same approach of the Li&Ma significance formula, but assuming that the background (the model in this case) is not fluctuating.
An update to gammalib GSkyMap was necessary to allow the evaluation of logarithm and sign of the sky maps.
I also added a few tests running csresmap with SUBDIVSQRT and SIGNIF algorithms.
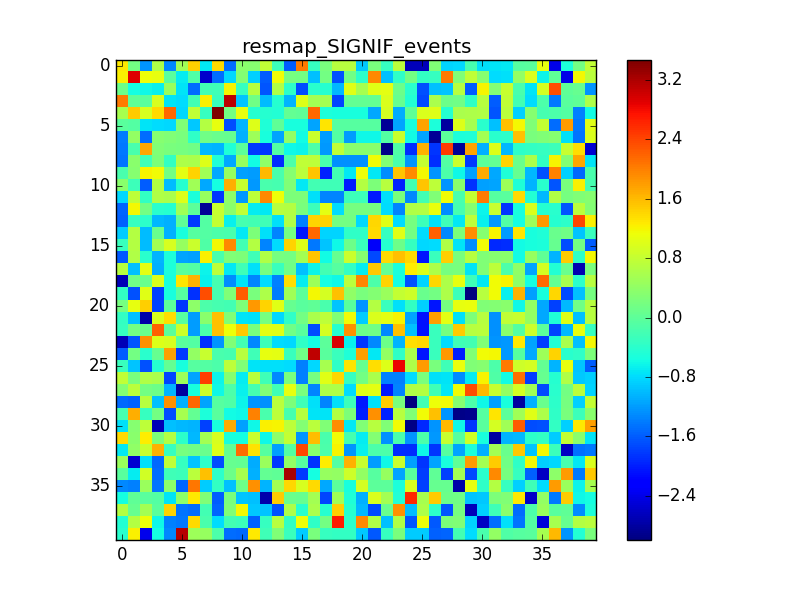
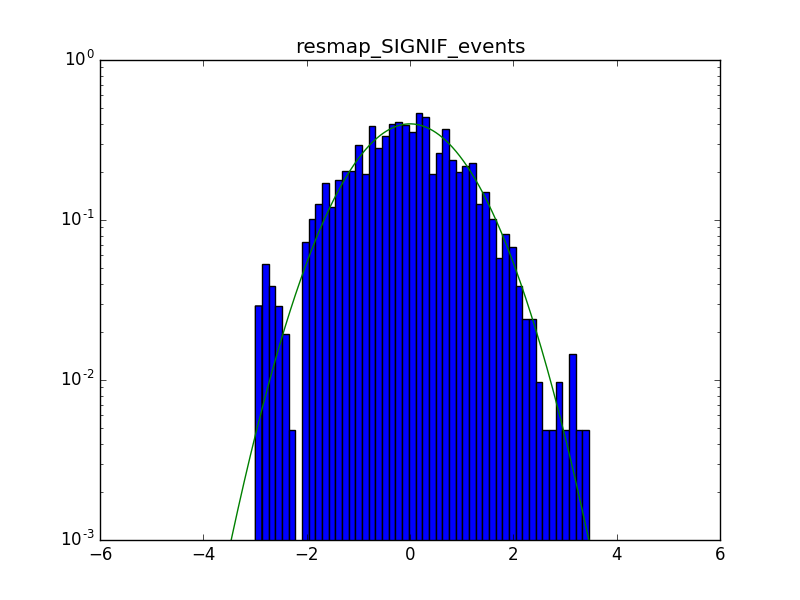
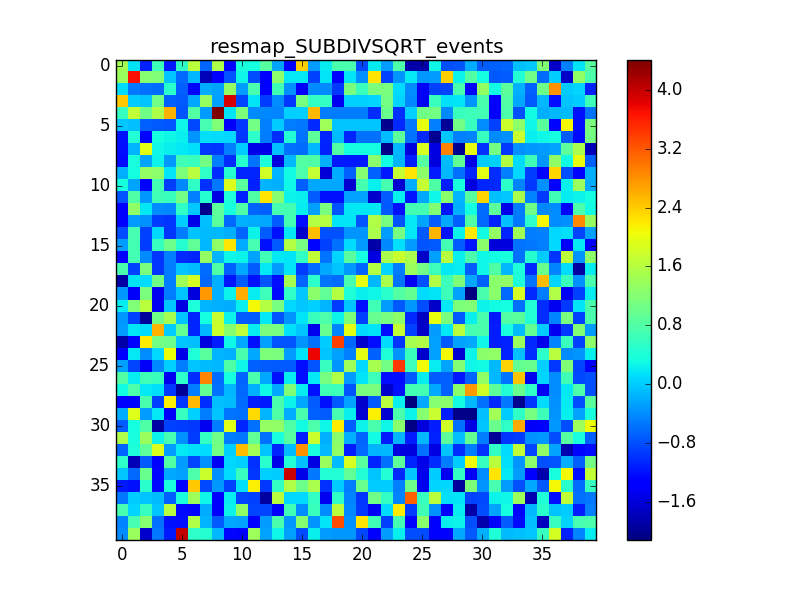
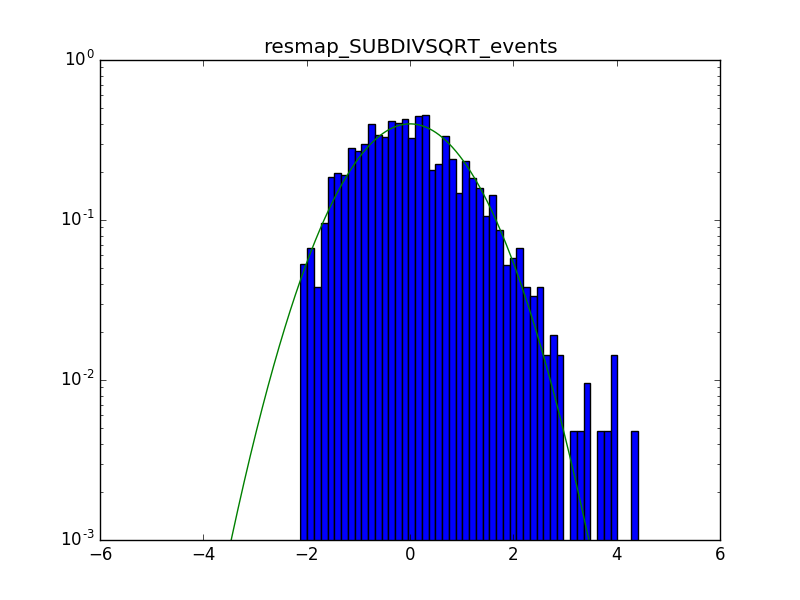
I tested both the SUBDIVSQRT and SIGNIF algorithms using a simple simulation of Crab data. The following plots show the maps and the distribution of residuals in the two cases.
It must be noted that being in the low-count regime, the two algorithms might produce different results in terms of significance. Furthermore, in this regime both algorithms might produce distributions that diverge from a normal distribution.


These are the details of the ctools and gammalib branches.
CTools: git@cta-gitlab.irap.omp.eu:ldivenere/ctools.git
CTools branch: 1867-csresmap-significance-map
Gammalib: git@cta-gitlab.irap.omp.eu:ldivenere/gammalib.git
Gammalib brach: 1867-csresmap-add-log-map-GSkyMap
#4
 Updated by Knödlseder Jürgen over 7 years ago
- Status changed from Pull request to Closed
Code merged into devel.


