Support #1968

ctbin and ctmodel don't match up
| Status: | In Progress | Start date: | 03/16/2017 | ||
|---|---|---|---|---|---|
| Priority: | Normal | Due date: | |||
| Assigned To: |  Knödlseder Jürgen Knödlseder Jürgen | % Done: | 10% | ||
| Category: | - | ||||
| Target version: | - | ||||
| Duration: |
Description
Hi,
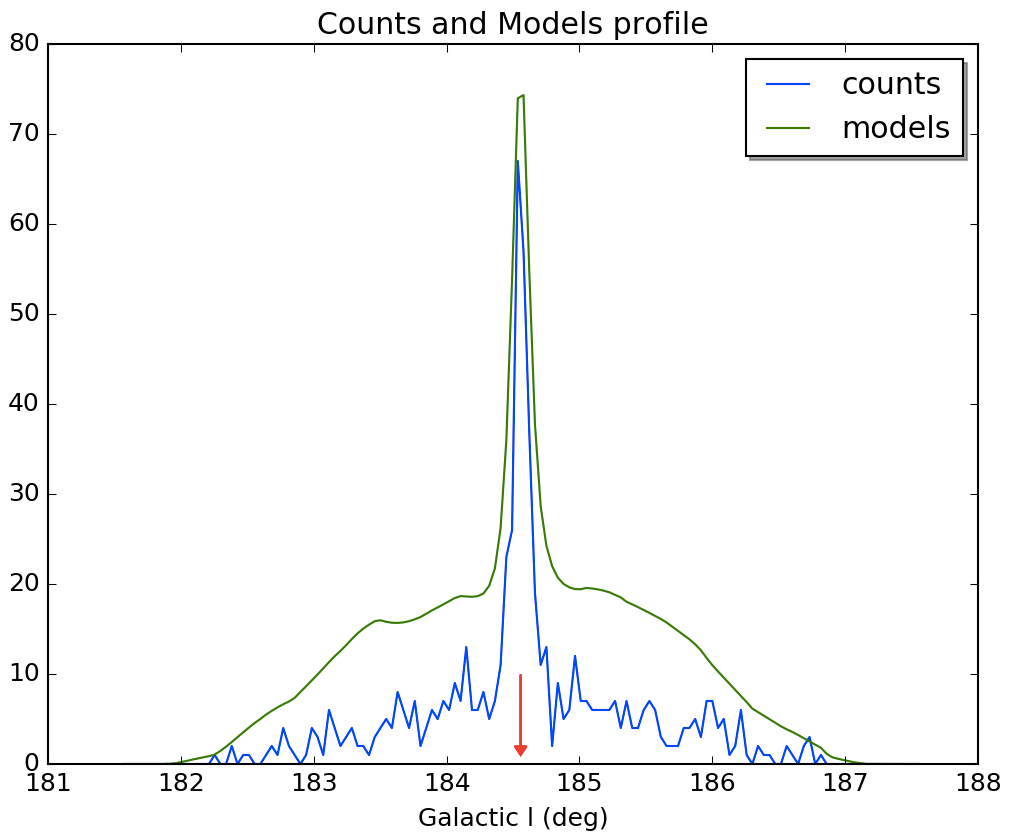
I’ve got a few hours of data on the crab, and when I run ctlike on them, and plot the counts and model-predicted-counts, they don’t to match up like I’d expect. I’ve attached the plot. Specifically, the counts in the backgrounds are about half what the models find.
The code that produces the plot:
def model_counts_profile_2( obs, center, erange=[0.085, 200.0], temp_dir='' ) :
  """plot the counts and model counts of a gobservations object.

  Profile will be centered on 'center', extending 3 degrees to either side.

  **Args:**
    obs : gammalib.GObservations object containing event lists and ctlike'd models
    center : gammalib.GSkyDir() object, the center of the plot
  """

  # project either along the galactic 'l' or 'b' axis
  axis = 'l'

  # degrees from the center for profile
  expanse_deg = 3.0

  # pixels from the center for profile
  expanse_pix = 70

  en_min = min(erange)
  en_max = max(erange)

  if temp_dir == '' :
    temp_dir = tempfile.mkdtemp()
  mkdir( temp_dir )

  npix  = 2 * expanse_pix
  binsz = expanse_deg / expanse_pix
  if axis == 'l' :
    nxpix = npix
    nypix = 1
  elif axis == 'b' :
    nxpix = 1
    nypix = npix

  print('only using from %.3f - %.1f TeV' % ( en_min, en_max ) )
  ctbinfits = os.path.join( temp_dir, 'ctbin.fits' )
  cb = ctools.ctbin( obs )
  cb['emin'    ] = en_min
  cb['emax'    ] = en_max
  cb['enumbins'] = 1
  cb['ebinalg' ] = 'LIN'
  cb['usepnt'  ] = False
  cb['coordsys'] = 'GAL'
  cb['xref'    ] = center.l_deg()
  cb['yref'    ] = center.b_deg()
  cb['nxpix'   ] = nxpix
  cb['nypix'   ] = nypix
  cb['binsz'   ] = binsz
  cb['proj'    ] = 'TAN'
  cb.run()
  print(cb.cube())
  print()
  print('saving ctbin\'s cube to %s' % ctbinfits )
  cb.cube().save( ctbinfits, True )
  ctbinfig = aplpy.FITSFigure( ctbinfits )
  print()

  ctmodelfits = os.path.join( temp_dir, 'ctmodel.fits' )
  cm = ctools.ctmodel( obs )
  cm['incube'  ] = 'NONE'
  cm['emin'    ] = en_min
  cm['emax'    ] = en_max
  cm['enumbins'] = 1
  cm['ebinalg' ] = 'LIN'
  cm['coordsys'] = 'GAL'
  cm['xref'    ] = center.l_deg()
  cm['yref'    ] = center.b_deg()
  cm['nxpix'   ] = nxpix
  cm['nypix'   ] = nypix
  cm['binsz'   ] = binsz
  cm['proj'    ] = 'TAN'
  print('ctmodelling...')
  cm.run()
  print(cm.cube())
  print('saving ctmodel\'s cube to %s' % ctmodelfits )
  cm.cube().save( ctmodelfits, True )
  ctmodelfig = aplpy.FITSFigure( ctmodelfits )
  print()

  prof_x = numpy.zeros( npix )
  prof_counts = numpy.zeros( npix )
  prof_models = numpy.zeros( npix )
  slice_index = 0
  for i in range(npix) :
    if axis == 'l' :
      l, b = ctbinfig.pixel2world( i+1, 1 )
      prof_x[i] = l
      prof_counts[i] = ctbinfig._data[  slice_index][i]
      prof_models[i] = ctmodelfig._data[slice_index][i]
    elif axis == 'b' :
      l, b = ctbinfig.pixel2world( 1, i+1 )
      prof_x[i] = b
      prof_counts[i] = ctbinfig._data[  i][slice_index]
      prof_models[i] = ctmodelfig._data[i][slice_index]

  fig = plt.figure()
  fax = fig.add_subplot(111)
  fax.plot( prof_x, prof_counts, label='counts' )
  fax.plot( prof_x, prof_models, label='models' )
  maxy = max( prof_counts + prof_models ) * 0.07
  if   axis == 'l' : arrowx = center.l_deg()
  elif axis == 'b' : arrowx = center.b_deg()
  print('arrowx:',arrowx)
  print('maxy:', maxy)
  fax.arrow( arrowx, maxy, 0, -0.8*maxy, color='red', head_width=(max(prof_x)-min(prof_x))*0.015, head_length=0.1*maxy )
  legend = fax.legend( loc='upper right', shadow=True )
  plt.title('Counts and Models profile')
  if   axis == 'l' : plt.xlabel('Galactic l (deg)')
  elif axis == 'b' : plt.xlabel('Galactic b (deg)')
  plt.savefig( 'plot.png', dpi=150 )
Is this normal, or does this hint that theres a problem with my data/irfs/models?
Screenshot 2017-03-16 19.21.40.png - profile plot of the crab (97.9 KB)
ReconMethodDisp.Cut-NTel2-ExtendedSource-Hard.targ.crab.allenergies.science.pntsrcatom.galb.cmprofile.png - crab - counts vs model profile - all energies (81.6 KB)


Recurrence
No recurrence.
History
#1
 Updated by Knödlseder Jürgen over 7 years ago
- Status changed from New to In Progress
- Assigned To set to Knödlseder Jürgen
- % Done changed from 0 to 10
I see that you use a single energy bin over a wide energy range for the ctmodel computation which is likely the origin of the problems.
ctmodel does not integrate over the energy bins but evaluates a model at the centre of the energy bin. You have chosen a linear energy range between 85 GeV and 200 TeV, hence the model is evaluated at 100 TeV. What you need to do is to evaluate the model for a sufficiently large number of energy bins, and then sum the model counts over all energy bins. I’d also recommend to use logarithmical binning for that.
#2
 Updated by Kelley-Hoskins Nathan over 7 years ago
Ah, that makes sense. I thought it was doing some kind of integration for each energy bin.
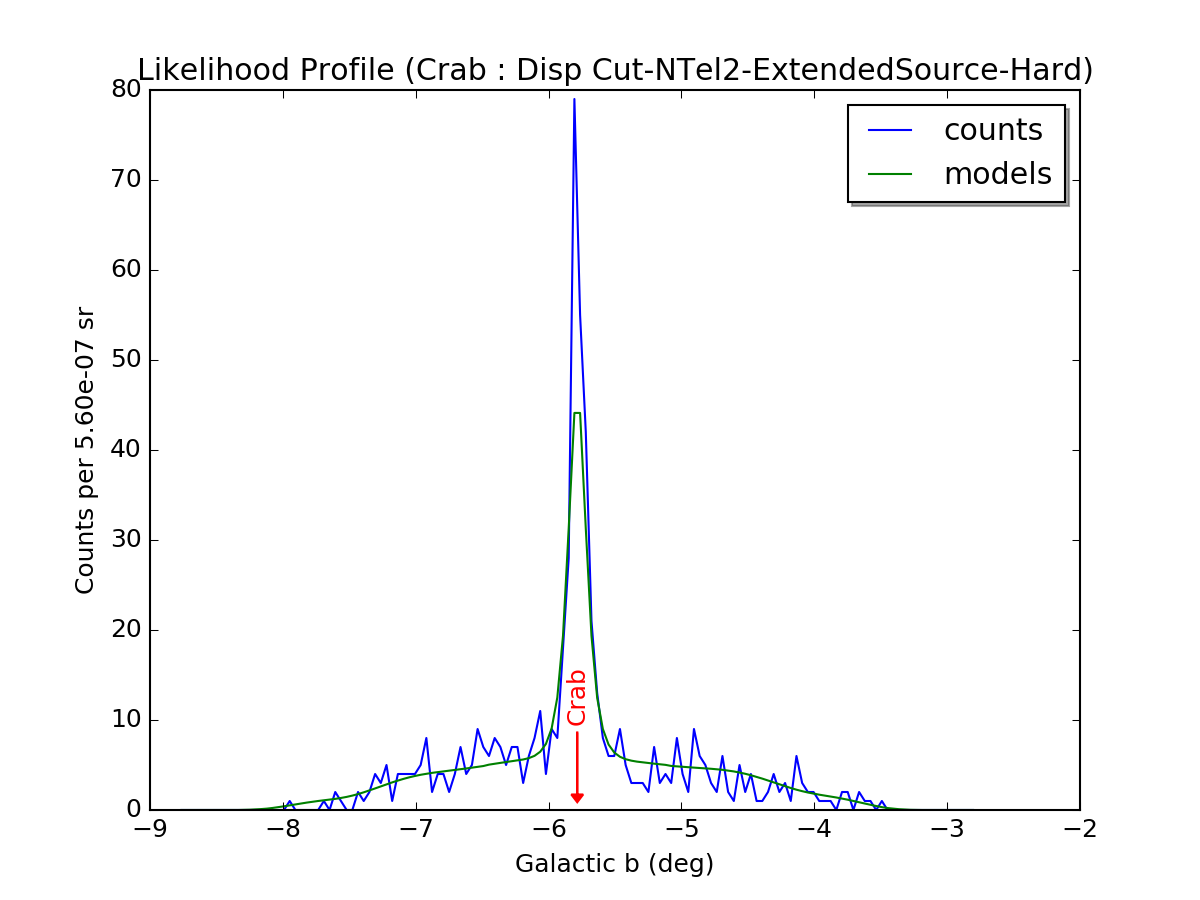
I’ve attached a plot of what it looks like now (with 200 log energy bins in ctmodel). Is the reason the crab’s model peak is cut off due to the sampling bin size, and that the slope of the model surface is changing rapidly across one bin width? I think its a balancing game, since smaller bin sizes mean a more accurate model profile, but also mean larger variations in the counts profile.
I’m wondering if theres anything preventing me from running ctmodel with a smaller bin width, and scaling its values up by something like (ctbin_bin_width / ctmodel_bin_width)^2 ?
#3
Updated by Kelley-Hoskins Nathan over 7 years ago
that the slope of the model surface is changing rapidly across one bin width?
Ah, nevermind, its cut off because of the sampling resolution. The distance between points (determined by ctmodel’s bin width) is causing it to just miss the peak of the crab. Smaller ctmodel bin sizes would still fix this, though.