Bug #1975

ctskymap with IRF background subtraction produces non flat structure
| Status: | Closed | Start date: | 03/19/2017 | |
|---|---|---|---|---|
| Priority: | Urgent | Due date: | ||
| Assigned To: |  Knödlseder Jürgen Knödlseder Jürgen | % Done: | 100% | |
| Category: | - | |||
| Target version: | 1.3.0 | |||
| Duration: |
Description
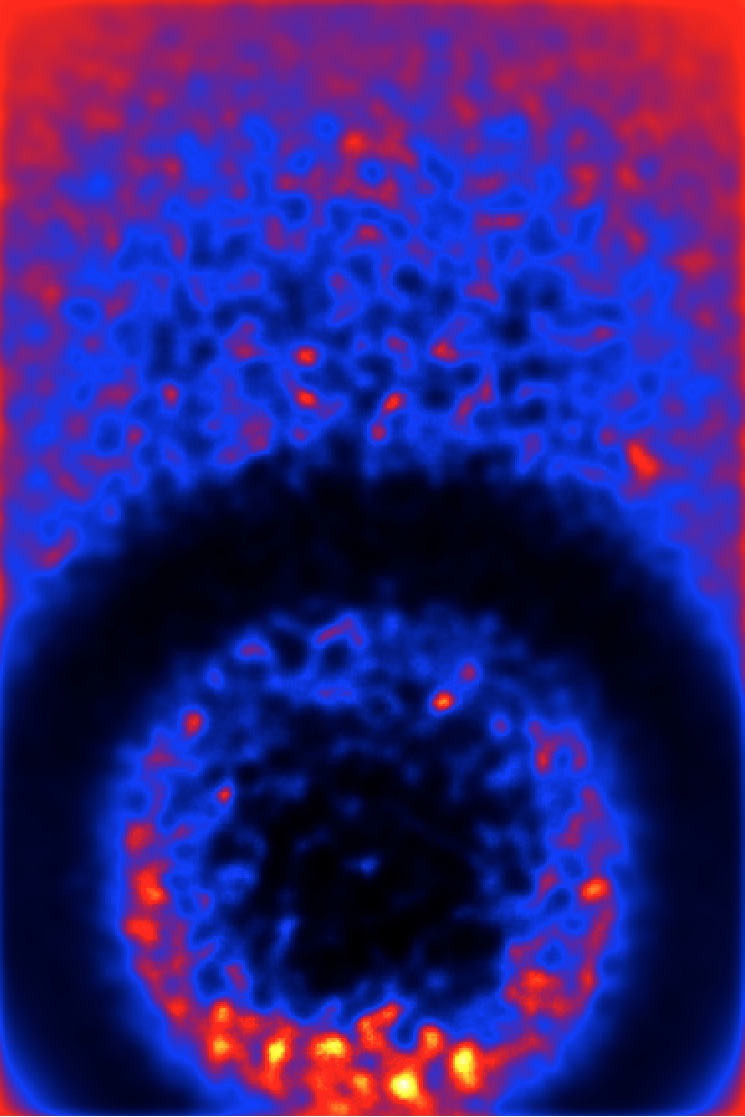
A ctskymap run with IRF background subtraction on the GC KSP simulated data for background + Dark Matter only results in the following map:

ctskymap_orig.jpg (128 KB)
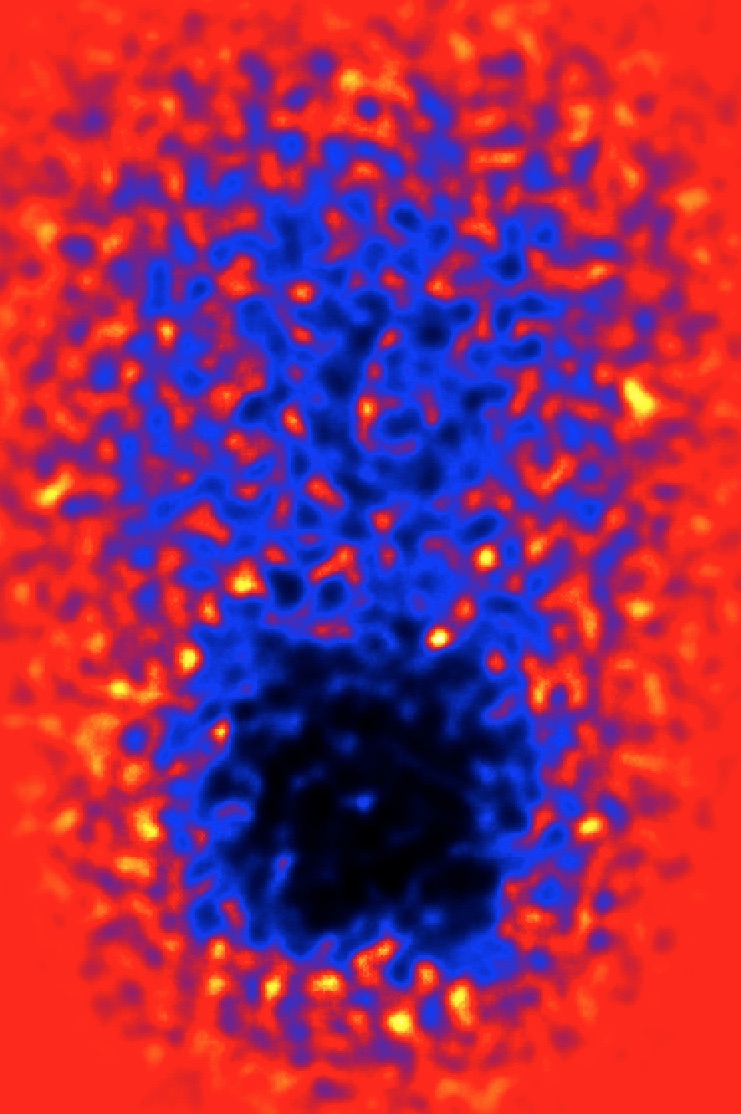
ctskymap_roi.jpg (178 KB)
trapezoid-vs-numerical.jpg (312 KB)
trapezoid-vs-numerical-20GeV.jpg (233 KB)


Recurrence
No recurrence.
History
#1
 Updated by Knödlseder Jürgen almost 8 years ago
- File ctskymap_roi.jpg added
- Status changed from New to In Progress
Part of the problem was related to the fact that the RoI information has not be taken into account in ctskymap. This has been corrected and resulted in the sky map below. Note that the ring like structure disappared, but the overall negative structure in the centre of the observations remained. It should be noted that the sky map has been obtained for the 30 GeV - 120 TeV energy range.
 |
#2
Updated by Knödlseder Jürgen almost 8 years ago
- % Done changed from 0 to 20
#3
Updated by Knödlseder Jürgen almost 8 years ago
- File trapezoid-vs-numerical.jpg added
- % Done changed from 20 to 50
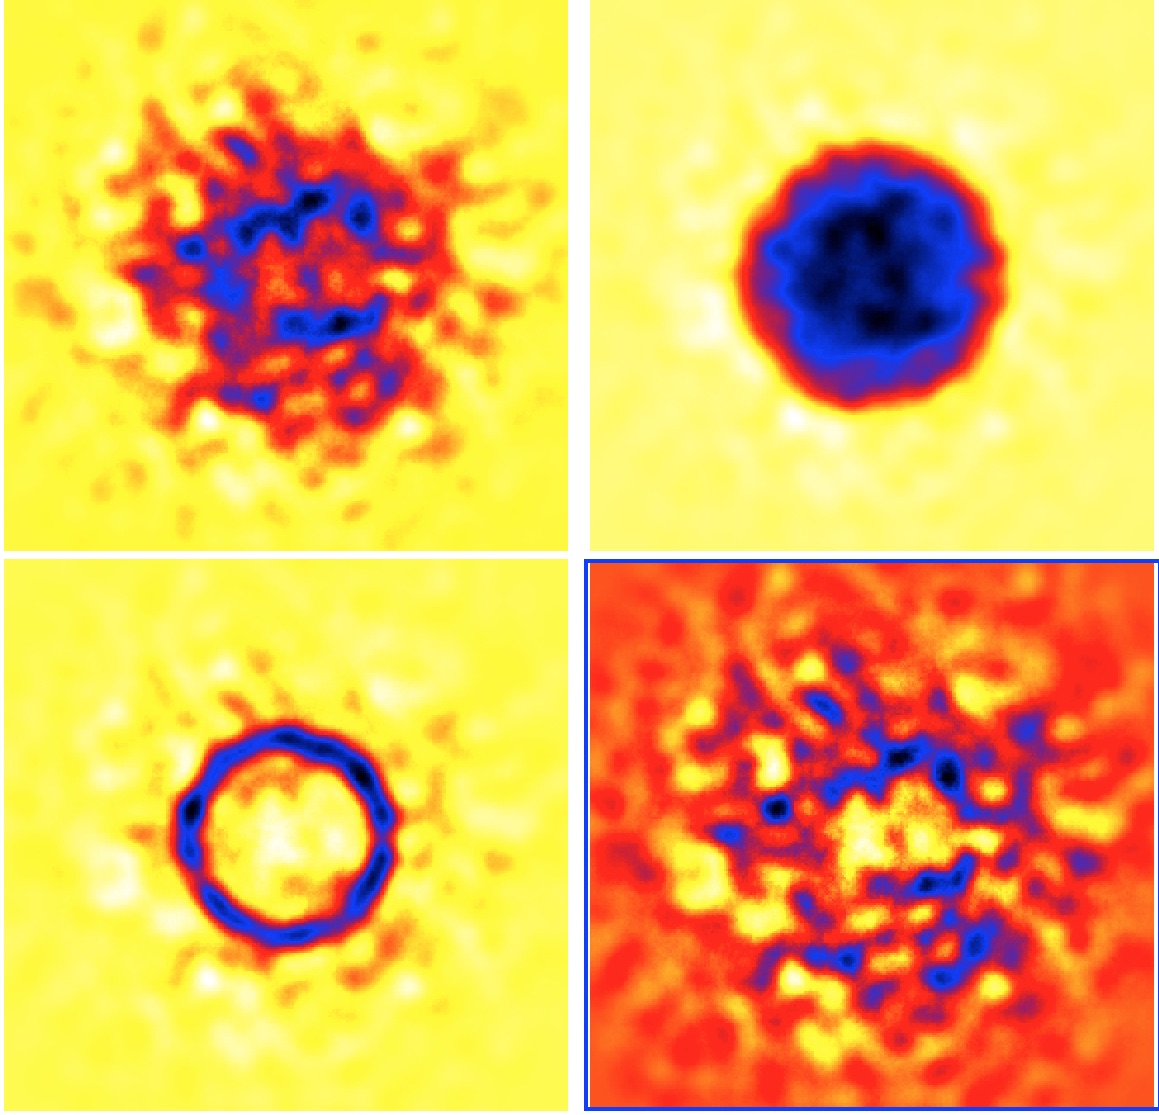
It appears that the problem goes away once the lower energy threshold is raised to 40 GeV. This means that the problem is related to the energy integration of the background model. The actual code uses a simple trapezoid rule with 20 nodes per decade. For the 30 GeV - 120 TeV energy range this corresponds to 72 nodes.
I replaced the trapezoid rule by a numerical integration. Below a plot that compares the result for a 50h simulation of background only in the Crab region for an energy range of 30 GeV - 120 TeV. The top-left plot shows the original background subtracted sky map. The negative depression is also seen in this case. The top-right plot shows the numerical integration for a precision of 1e-4. With that precision, 33 evaluations have been done, which obviously is not sufficient. The bottom-left and bottom-right plots show precisions of 1e-5 and 1e-6. The respective (maximum) number of evaluations is 129 and 1057. From the plot it appears that 1e-5 is sufficient in precision.
#4
Updated by Knödlseder Jürgen almost 8 years ago
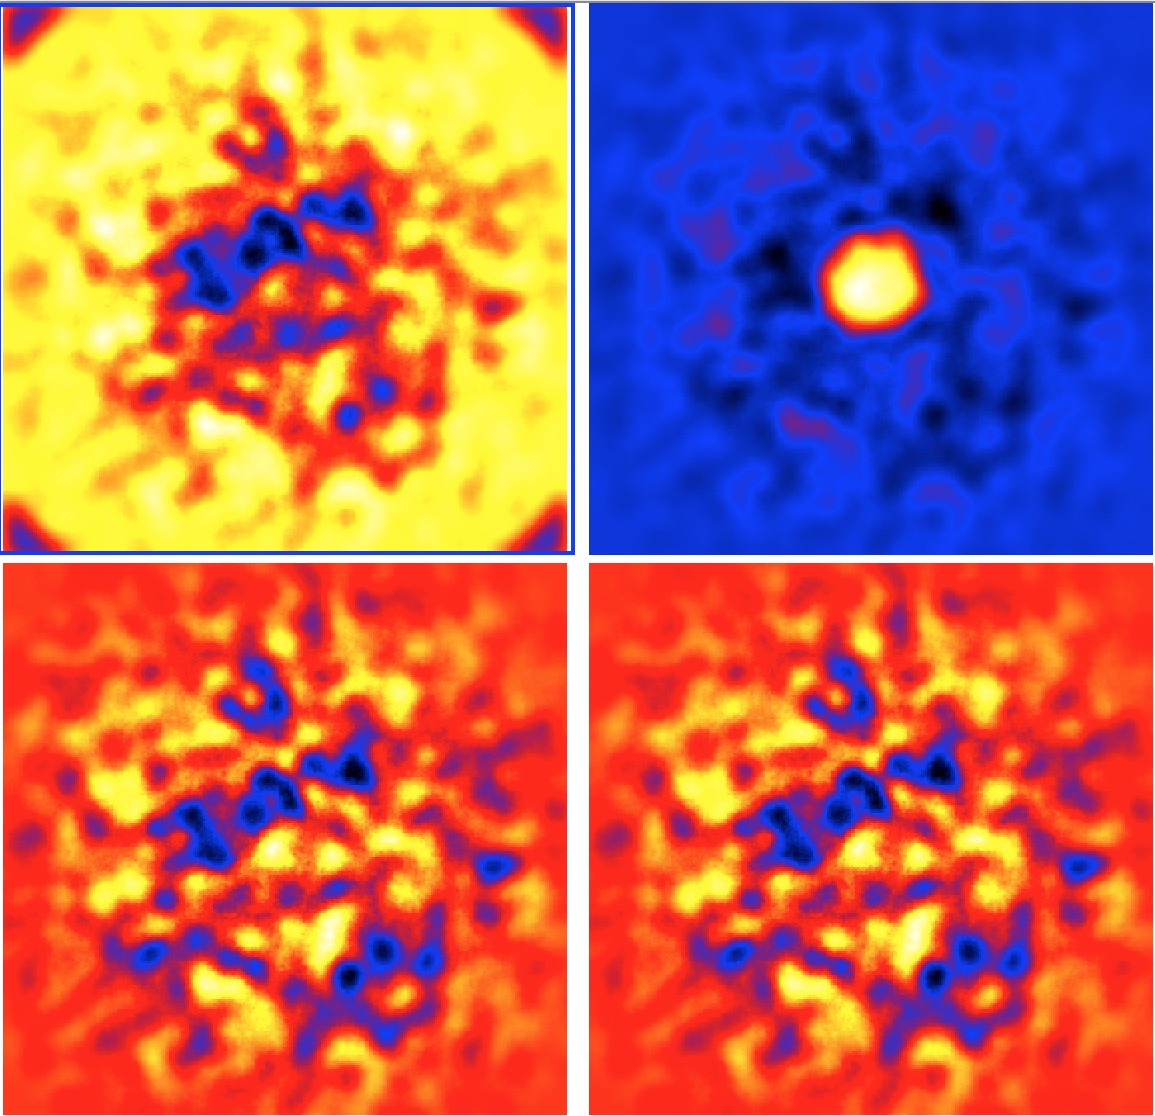
- File trapezoid-vs-numerical-20GeV.jpg added
- % Done changed from 50 to 60
Repetition of the experiment for a lower energy boundary of 20 GeV indicates that a precision of 1e-6 is needed to reach a clean map. Note that the (maximum) number of evaluations reached 513 in this case, which compares to 75 for the old evaluation scheme. It may hence be useful to split the energy range into a number of sub-ranges since the problematic part of the integral is obviously the low-energy part.

#5
Updated by Knödlseder Jürgen almost 8 years ago
- % Done changed from 60 to 80
I did some more tests and finally decided to not subdivide the energy range as this led to a very high number of background template evaluations. Instead I set the integration precision to 1e-7.
#6
Updated by Knödlseder Jürgen almost 8 years ago
With a precision of 1e-7 the jobs become awfully slow, a precision of 1e-6 seems to sufficient, so I fix this value now.
#7
Updated by Knödlseder Jürgen almost 8 years ago
- Status changed from In Progress to Closed
- % Done changed from 80 to 100