Bug #2000

Negative residuals obtained with csresmap
| Status: | New | Start date: | 04/13/2017 | |
|---|---|---|---|---|
| Priority: | High | Due date: | ||
| Assigned To: | - | % Done: | 0% | |
| Category: | - | |||
| Target version: | - | |||
| Duration: |
Description
I’ve generated some events using ctobssim and then applied the csresmap script to calculate residual maps (using the same model used for simulation).
I noticed that residual maps produced have some negative residuals especially when the simulated source is strong.
A few examples follow in which I simulated the Crab and the background and I varied their fluxes.
1. Model: Crab + Bkg 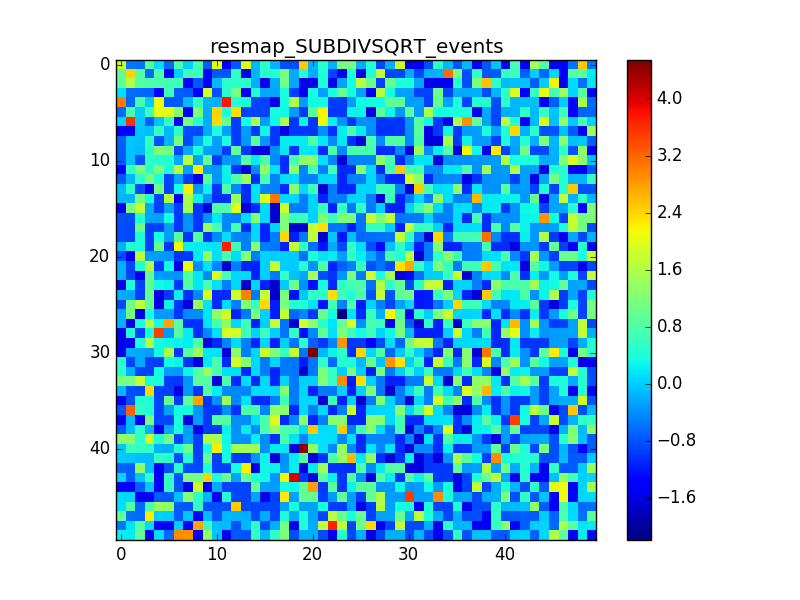
2. Model: Crab x10 + Bkg
3. Model: Crab x100 + Bkg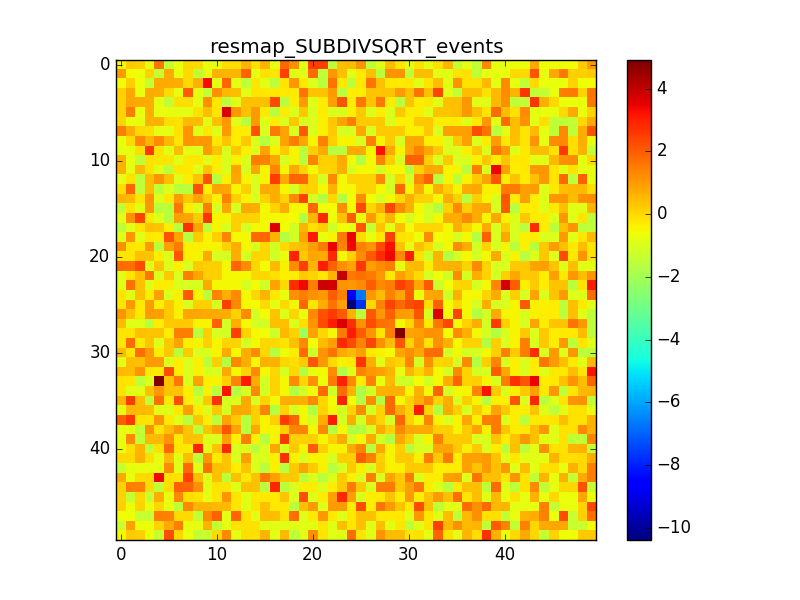
4. Model: Crab + Bkg x10
In cases 2 and 3 it is evident that there is an anomalous negative residual corresponding to the source at the center, while case 4 shows that the background is fine also with a higher flux.
I also calculated the residual maps directly from countmaps and modelmaps (obtained using ctbin and ctmodel respectively) using an external tool (ftimgcalc). The result was the same.
crab_bkgx10_resmap_SUBDIVSQRT_events_image.png (35.7 KB)
crab_bkg_resmap_SUBDIVSQRT_events_image.png (34.4 KB)
crabx10_bkg_resmap_SUBDIVSQRT_events_image.png (31.5 KB)
crabx100_bkg_resmap_SUBDIVSQRT_events_image.png (30.9 KB)
crabx100_bkg_0p01deg_resmap_SUBDIVSQRT_events_image.png (62 KB)
crabx100_bkg_0p02deg_resmap_SUBDIVSQRT_events_image.png (49.9 KB)
crabx100_bkg_0p01deg_resmap_SUBDIVSQRT_events_smooth_image.png (139 KB)
crabx100_bkg_0p02deg_resmap_SUBDIVSQRT_events_smooth_image.png (62.8 KB)
crabx100_bkg_0p005deg_resmap_SUBDIVSQRT_events_smooth4_image.png (230 KB)
crabx100_bkg_0p005deg_resmap_SUBDIVSQRT_events_image.png (83 KB)
crabx100_bkg_0p005deg_resmap_SUBDIVSQRT_events_smooth10_image.png (277 KB)
crabx100_0p005deg_48bins_resmap_SUBDIVSQRT_events_smooth10_image.png (294 KB)
crabx100_0p005deg_48bins_resmap_SUBDIV_events_image.png (46.7 KB)
crabx100_0p005deg_48bins_resmap_SUBDIV_events_hist.png (21.7 KB)
crabx1000_bkgx10_0p005deg_40bins__smooth10_image.png (361 KB)
crabx1000_bkgx10_0p005deg_custombins__smooth10_image.png (350 KB)


Recurrence
No recurrence.
History
#1
 Updated by Knödlseder Jürgen over 7 years ago
What spatial binning have you selected?
The model evaluation for a binned analysis is done at the bin centre, hence you have to make sure that the spatial binning sufficiently well samples the PSF.
#2
 Updated by Di Venere Leonardo over 7 years ago
- File crabx100_bkg_0p01deg_resmap_SUBDIVSQRT_events_image.png added
- File crabx100_bkg_0p01deg_resmap_SUBDIVSQRT_events_smooth_image.png added
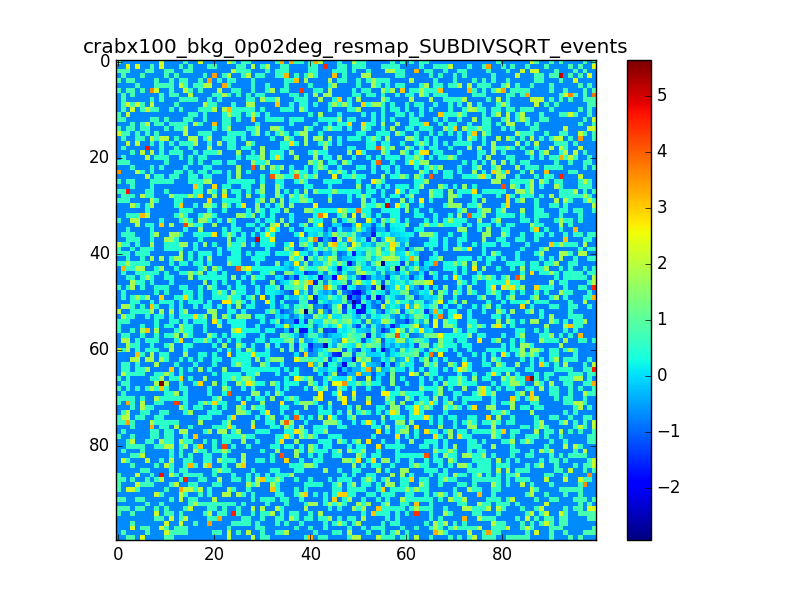
- File crabx100_bkg_0p02deg_resmap_SUBDIVSQRT_events_image.png added
- File crabx100_bkg_0p02deg_resmap_SUBDIVSQRT_events_smooth_image.png added
I used 0.04 degress binning.
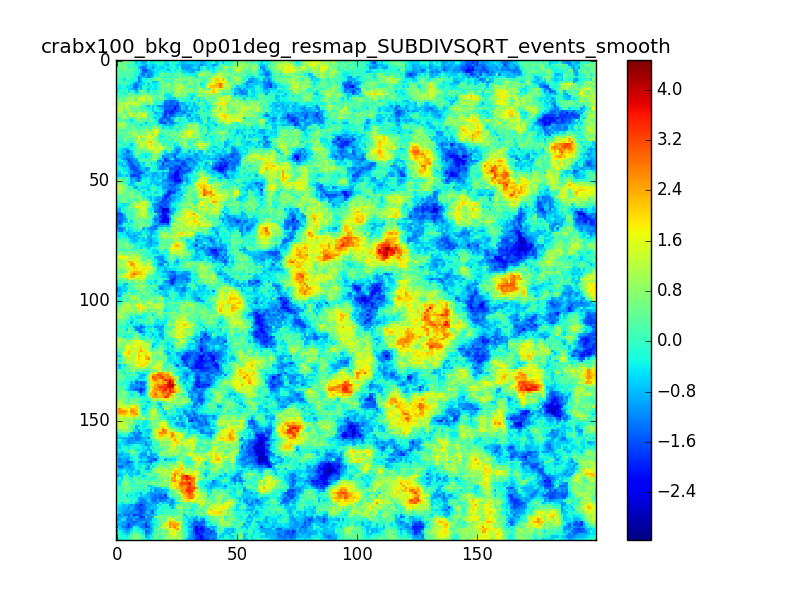
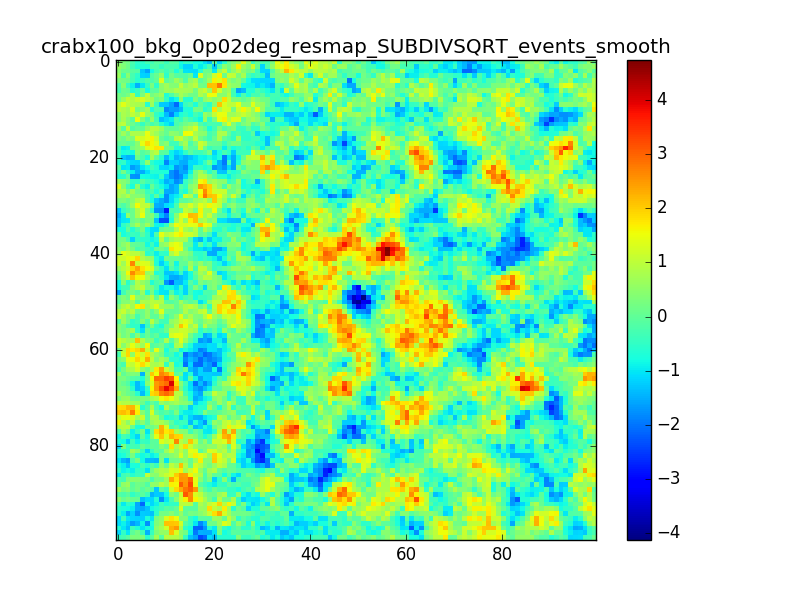
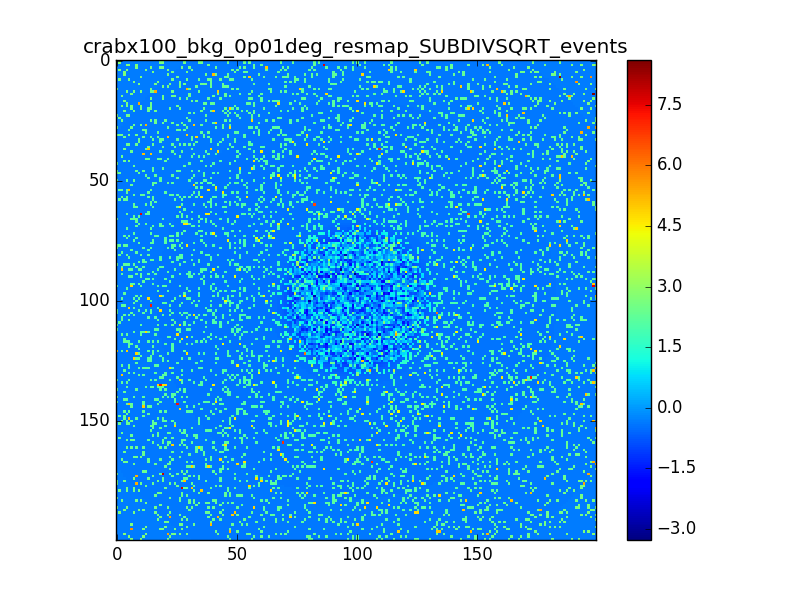
I tried also with a binning of 0.02 degrees and 0.01 degrees. In these cases there are a lot of pixels with 0 counts, so I smoothed a little the images with a Tophat2D kernel of 0.06 degrees.
The following plots show the unsmoothed and smoothed maps with these binnings obtained with a model containing a source with a flux 100 times of the Crab flux (case 3 in the description).
 |
 |
 |
 |
The structures in residuals are still evident, with a negative residual at the center of the source and positive structure around it. In the simulation and in ctmodel I am using caldb=“prod2”, irf=“South_0.5h”.
#3
Updated by Knödlseder Jürgen over 7 years ago
I’m wondering whether there is really a problem there or whether what you see is simply related to the fact that there are more events at the position of the Crab. Specifically, the smooth image for 0.01 deg looks pretty reasonable to me, the dip at the Crab position does not look worse than other dips in the image.
#4
Updated by Di Venere Leonardo over 7 years ago
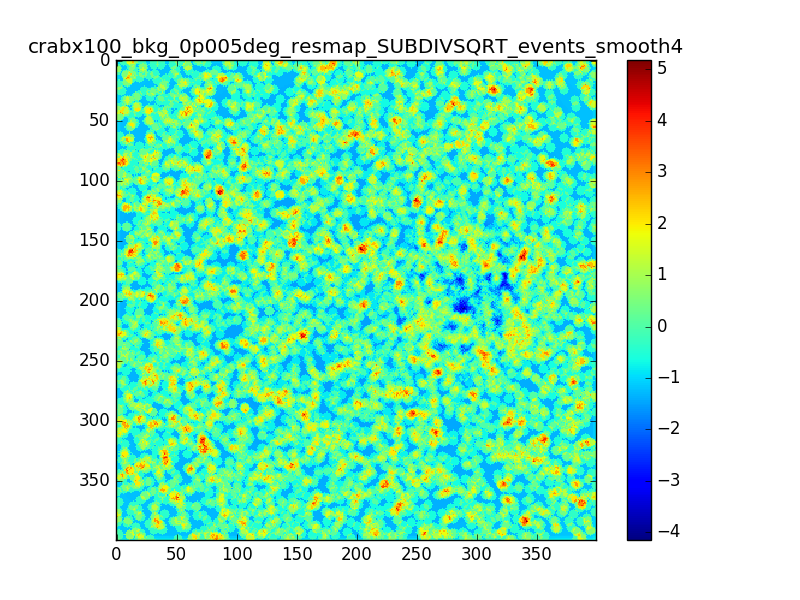
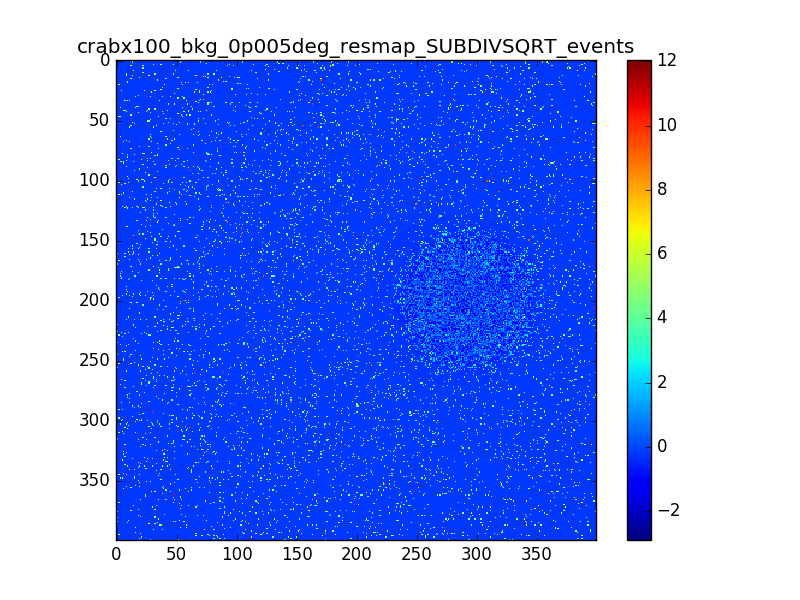
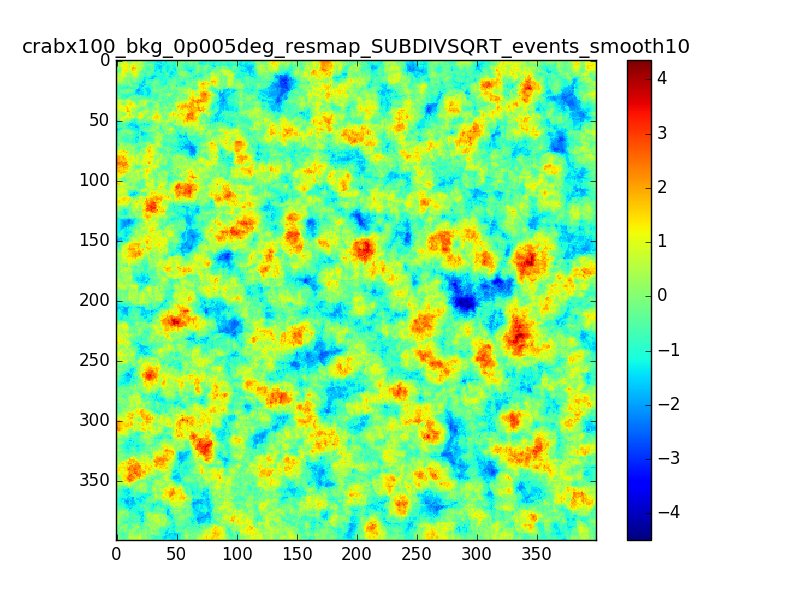
- File crabx100_bkg_0p005deg_resmap_SUBDIVSQRT_events_image.png added
- File crabx100_bkg_0p005deg_resmap_SUBDIVSQRT_events_smooth4_image.png added
- File crabx100_bkg_0p005deg_resmap_SUBDIVSQRT_events_smooth10_image.png added
Knödlseder Jürgen wrote:
I’m wondering whether there is really a problem there or whether what you see is simply related to the fact that there are more events at the position of the Crab.
What do you mean?
With smaller pixels the dip is smaller, but there is still the “ring” structure around the source. I also tried to move the source away from the center of the ROI, I generated events with a different seed and used a smoothing with different radii. The small dip and the ring excess are still there.
Some other plots with these attempts are attached, but the results do not change much.
(The details of the attached maps are: pixel size = 0.005 deg, source offset from te center of the ROI = 0.5 deg, smoothing radius = 0.02deg / 0.05 deg)
I don’t understand what I am doing wrong in producing the residual maps. The pixels are much smaller than the PSF (which is roughly 0.02-0.05 above 1 TeV right?) and the smoothing radii are compatible. I don’t expect to see these structures in the residual map. Do you think this effect might be due to the smoothing?
#5
Updated by Knödlseder Jürgen over 7 years ago
What energy range and how many energy bins are you using?
#6
Updated by Di Venere Leonardo over 7 years ago
I’m using 20 bins in log scale between 100 GeV and 100 TeV
#7
Updated by Knödlseder Jürgen over 7 years ago
Try more bins in energy to see if the situation improves.
Have you checked to how much percent the residuals correspond? Typically the code is tuned to have at least 1% accuracy.
#8
Updated by Di Venere Leonardo over 7 years ago
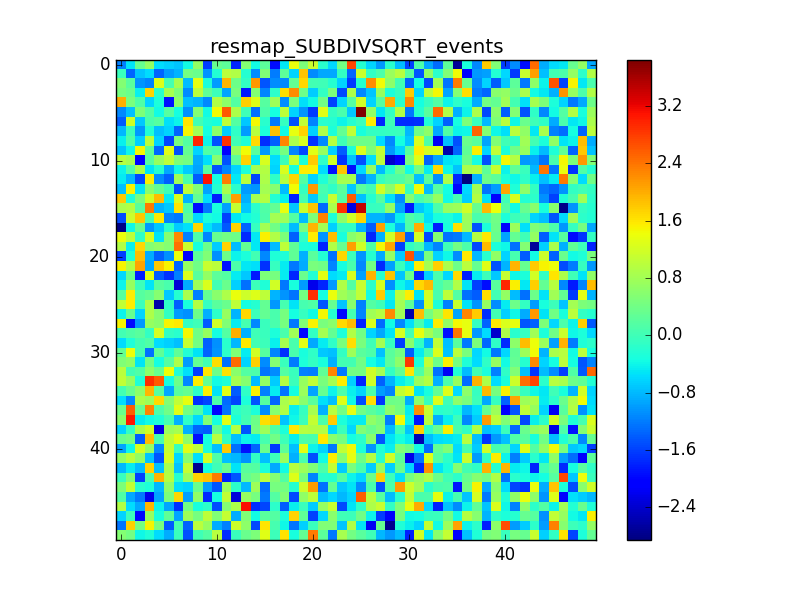
- File crabx100_0p005deg_48bins_resmap_SUBDIVSQRT_events_smooth10_image.png added
- File crabx100_0p005deg_48bins_resmap_SUBDIV_events_image.png added
- File crabx100_0p005deg_48bins_resmap_SUBDIV_events_hist.png added
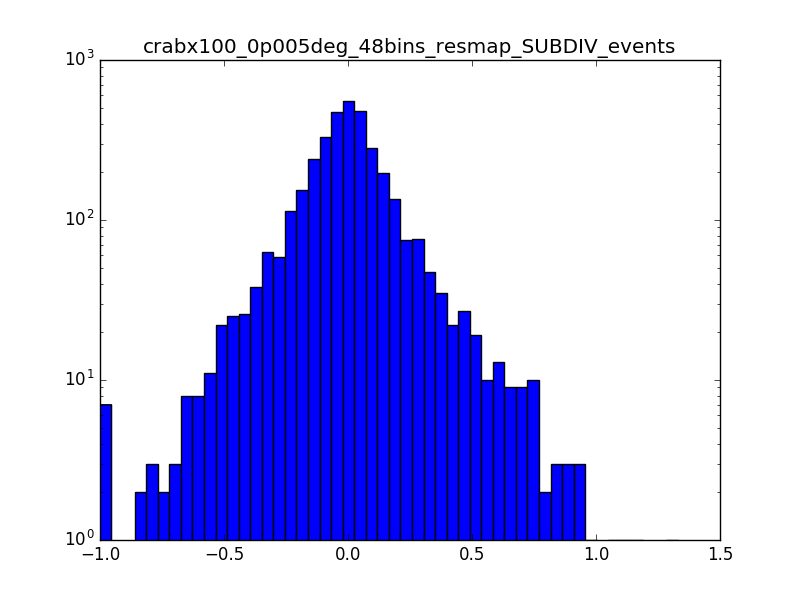
This is the same smoothed map as in my comment #4, but using 48 bins between 0.1 and 100 TeV (16 bins/decade)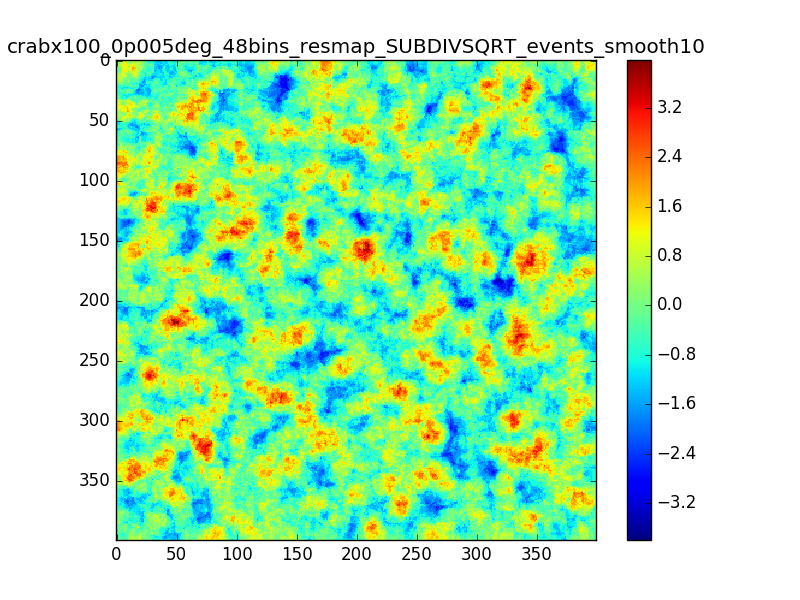
The effect seems to be reduced.
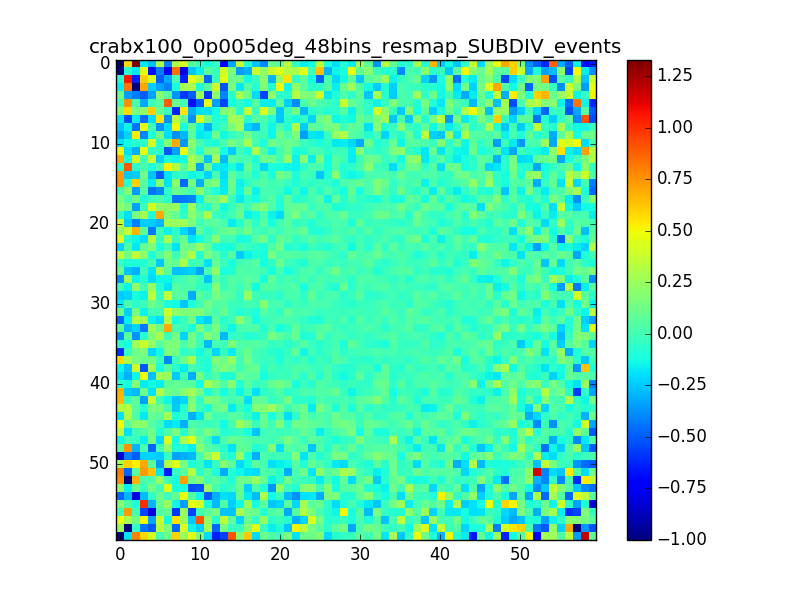
I also produced a residual map in terms of percentage (using the SUBDIV algorithm in csresmap). The following plots show the (unsmoothed) residual map zoomed on the region where the source is (radius of 0.15° around the source) and the relative distribution of pixels. A lot of pixels seem to have values larger than 1%.
 |
 |
#9
Updated by Di Venere Leonardo over 7 years ago
- File crabx1000_bkgx10_0p005deg_40bins__smooth10_image.png added
- File crabx1000_bkgx10_0p005deg_custombins__smooth10_image.png added
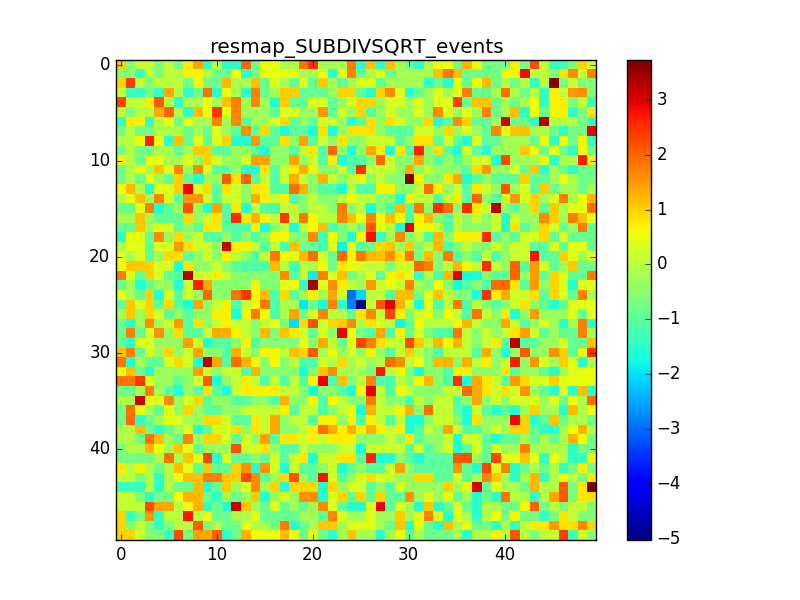
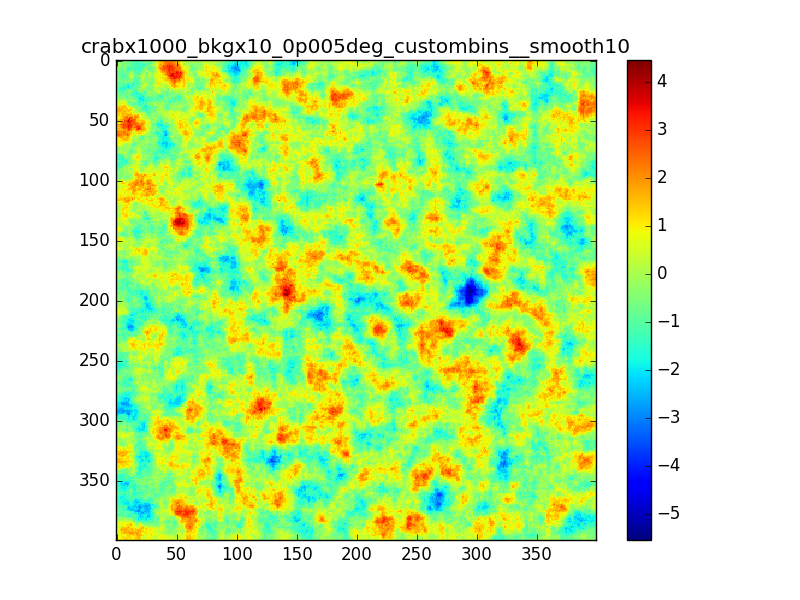
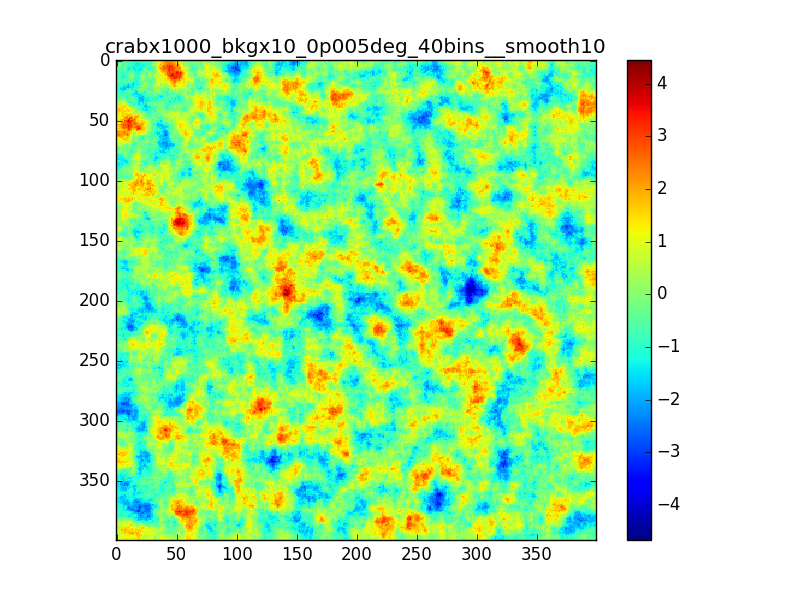
Following the discussion at the last ctool call, I tested the residual map using a custom energy binning generated with csebins.
The result is not very different from previous cases.
In the following plots I compare the case in which I used 40 bins equally spaced in log scale with the case in which csebins is used. For the record, the custom ebin file generated by csebins contains 33 energy bins.
 |
 |