Bug #2706
Correct science verification
| Status: | Closed | Start date: | 10/29/2018 | |
|---|---|---|---|---|
| Priority: | Normal | Due date: | ||
| Assigned To: | % Done: | 100% | ||
| Category: | - | |||
| Target version: | 1.6.0 | |||
| Duration: |
Description
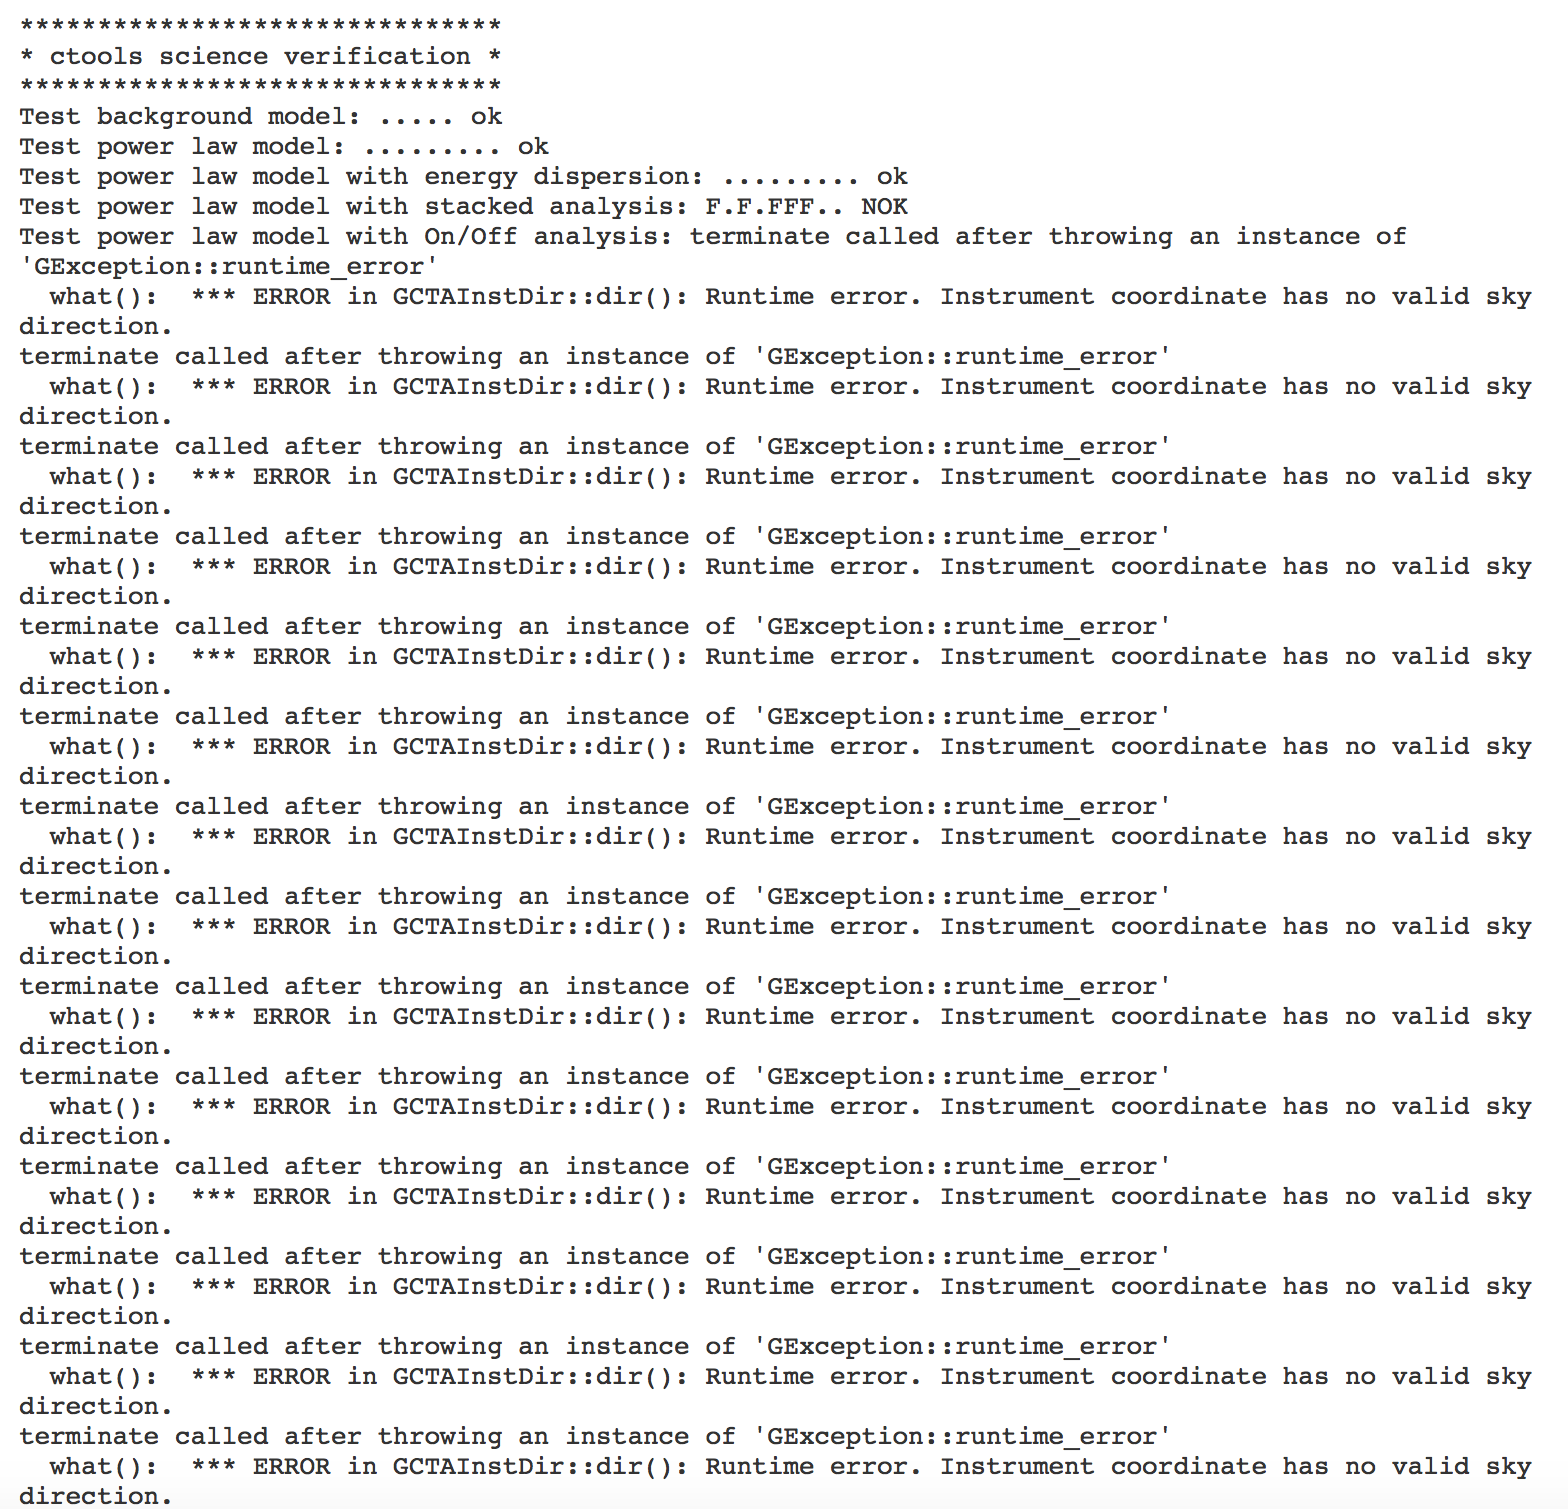
After the recent code changes, the science verification shows some errors (see below).
Recurrence
No recurrence.
History
#1
 Updated by Knödlseder Jürgen about 6 years ago
- File histogram_edisp_crab_prefactor.png added
- File histogram_edisp_crab_index.png added
- File histogram_edisp_bkg_prefactor.png added
- File histogram_edisp_bkg_index.png added
- File evolution_stacked_crab_prefactor.png added
- File evolution_stacked_crab_index.png added
- File evolution_stacked_bkg_prefactor.png added
- File evolution_stacked_bkg_index.png added
- Status changed from New to In Progress
- % Done changed from 0 to 10
*******************************
* ctools science verification *
*******************************
Test background model: ..... ok
Test power law model: ......... ok
Test power law model with energy dispersion: F........ NOK
Test power law model with stacked analysis: FFF.F.F.. NOK
Test power law model with On/Off analysis: E NOK
Test power law 2 model: ......... ok
Test smoothly broken power law model: ............. ok
Test exponentially cut off power law model: ........... ok
Test super exponentially cut off power law model: ............. ok
Test log parabola model: ........... ok
Test Gaussian model: ........... ok
Test file function model: ....... ok
Test nodes model: ............. ok
Test exponential model: ........... ok
Test point source model: ............. ok
Test radial disk model: ............... ok
Test radial Gaussian model: ............... ok
Test radial shell model: ................. ok
Test elliptical disk model:
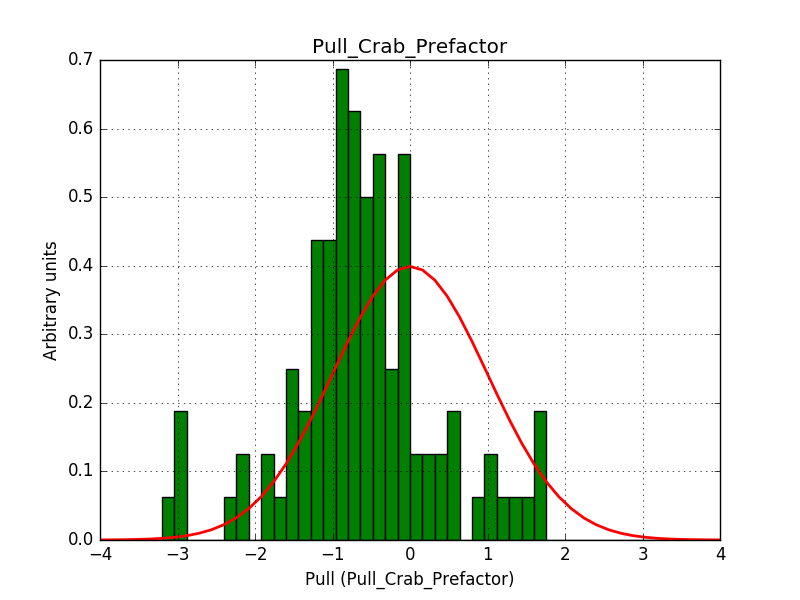
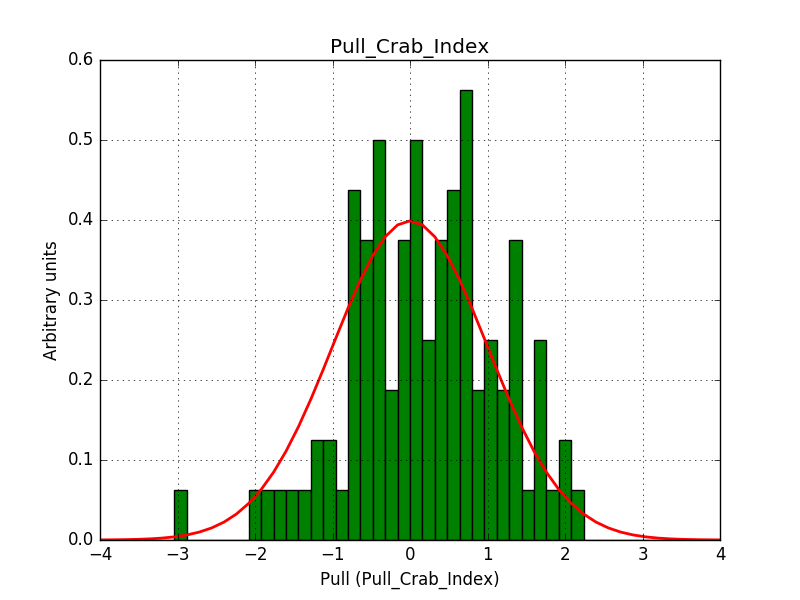
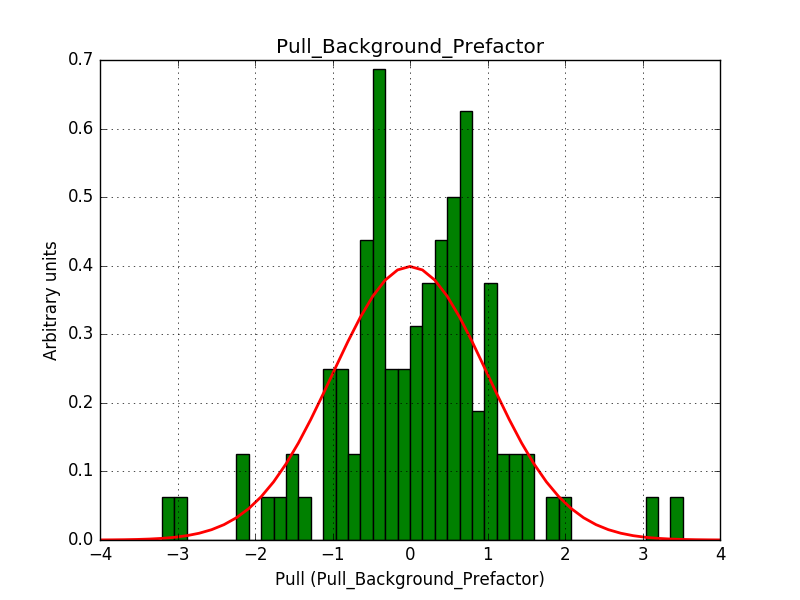
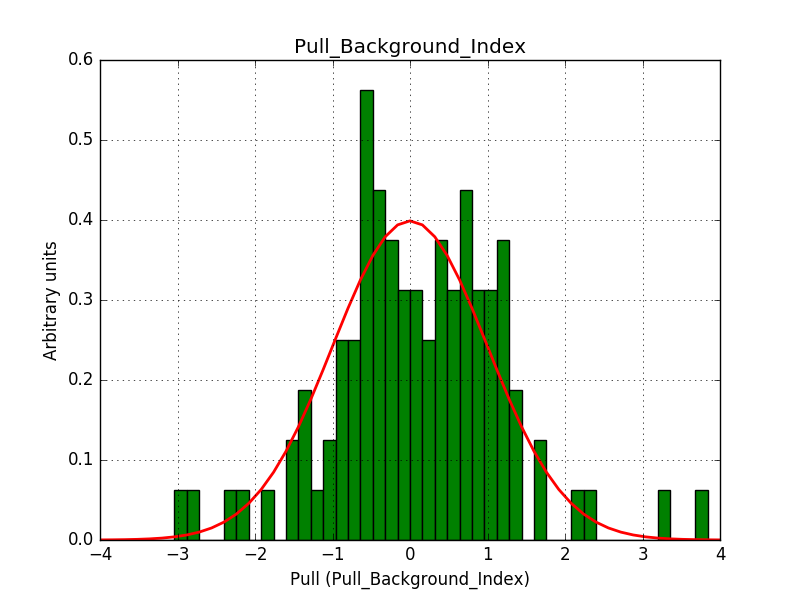
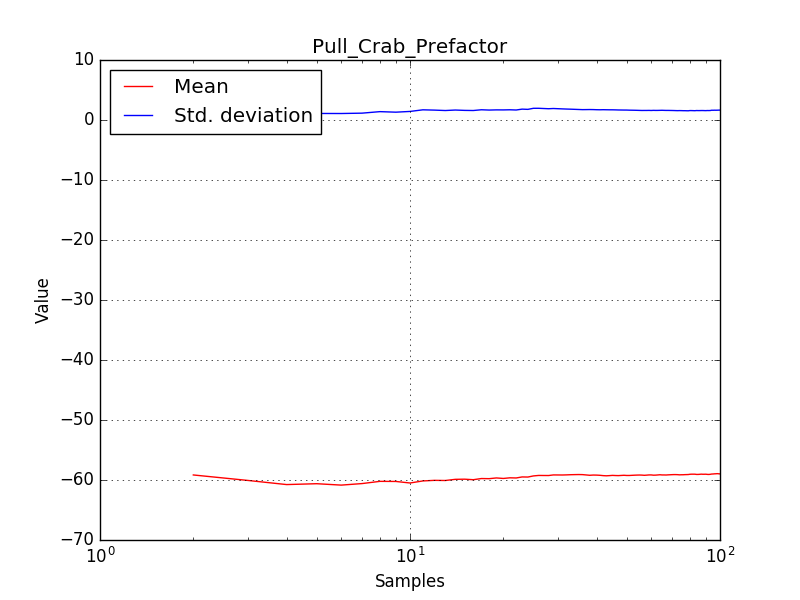
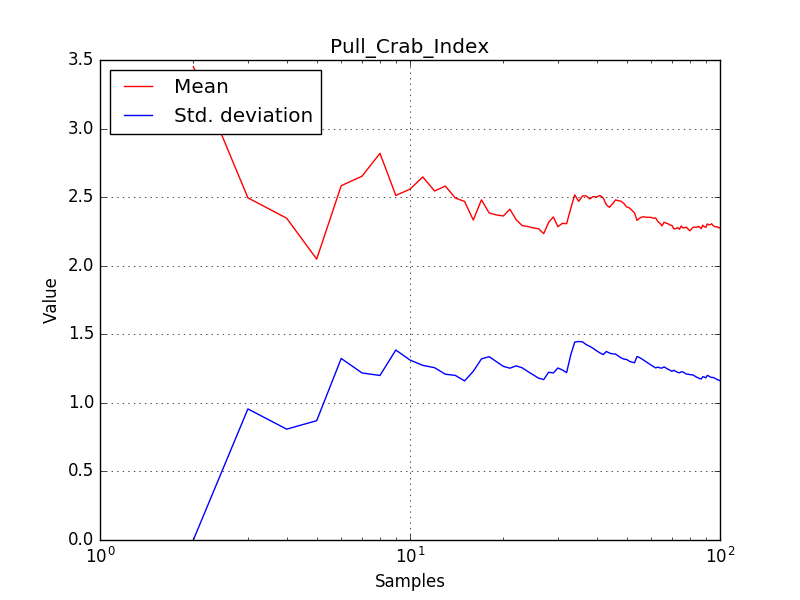
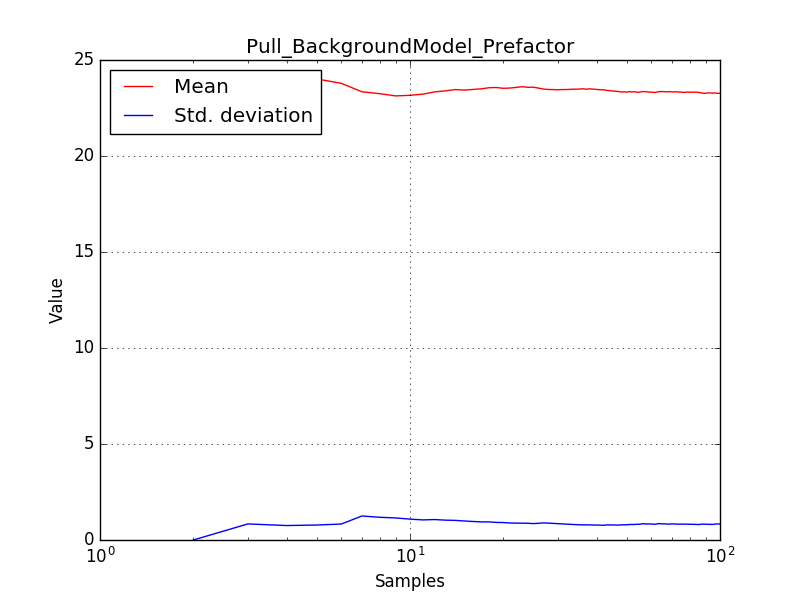
There is an issue with the pull histogram for the Crab prefactor when energy dispersion is considered, as illustrated in the plot belows:
 |
 |
 |
 |
 |
 |
 |
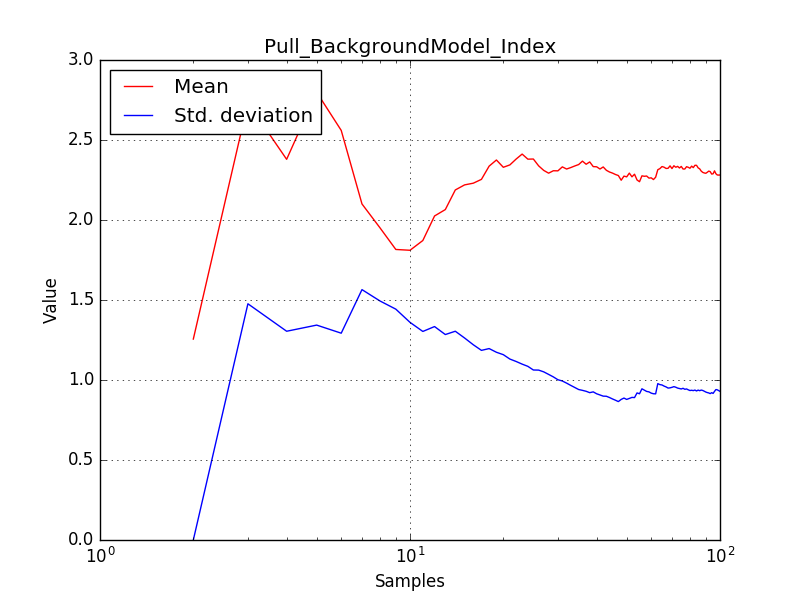 |
The On/Off analysis simply fails, probably due to the invalid instrument direction, as indicated above.
#2
 Updated by Knödlseder Jürgen about 6 years ago
- % Done changed from 10 to 20
It turned out that the On/Off problem was related to missing information in the observation definition XML file, such as the energy range and the region of interest. After adding the information, the science verification works:
Test power law model with On/Off analysis: ......... ok
#3
 Updated by Knödlseder Jürgen about 6 years ago
- File histogram_edisp-nosmooth_crab_prefactor.png added
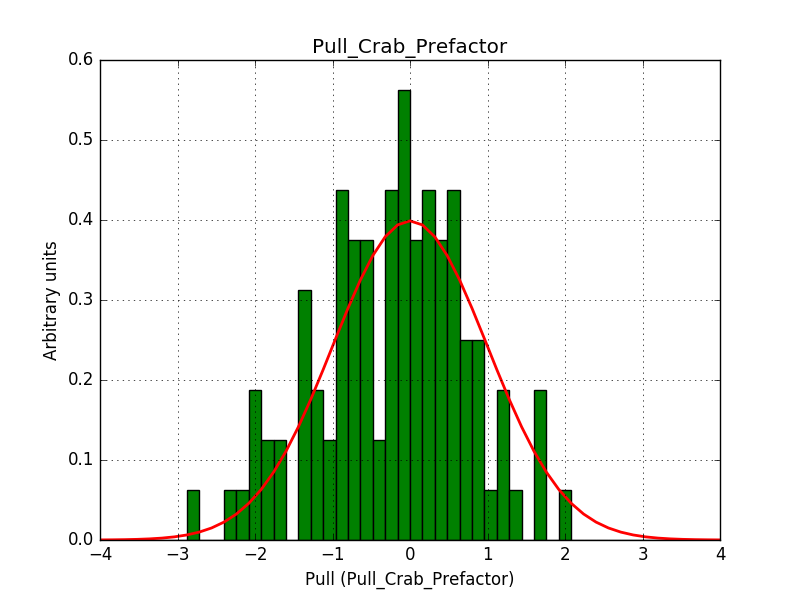
I now investigated the power law fit with the energy dispersion enabled. Switching off the smoothing of the energy dispersion resolves the issue. The plots below show the Prefactor pull distribution with smoothing of the energy dispersion (left) and without smoothing of the energy dispersion (right).
 |
 |
I then simulated 5 hours of Crab observation using the Prod2 IRF with energy dispersion and checked the results when fitting without and with energy dispersion enabled. The test were done for smoothing enabled or disabled. Events were simulated for reconstructed energies between 0.1-50 TeV.
| What | Edisp in fit | Prefactor (1e-16) | Index |
| Truth | - | 5.7 | 2.48 |
| Smoothing | No | 5.712 +/- 0.031 | 2.490 +/- 0.005 |
| Smoothing | Yes | 5.605 +/- 0.030 | 2.483 +/- 0.005 |
| No smoothing | No | 5.708 +/- 0.031 | 2.486 +/- 0.005 |
| No smoothing | Yes | 5.679 +/- 0.031 | 2.486 +/- 0.005 |
The analysis confirms the trend that with a smoothed IRF the Crab fluxes are underestimated. With smoothing enabled, the true energy range for a given reconstructed energy range becomes broader, leading to more photons that are simulated. Specifically, with smoothing enabled 608490 Crab photons were thrown while with smoothing disabled, 441251 Crab photons were thrown. The number of Crab events with smoothing were 37807, the number without smoothing was 37843.
Independently of what is right and what is wrong, the question is why there is a mismatch between simulations and Monte Carlo when smoothing is applied to the energy dispersion.
#4
 Updated by Knödlseder Jürgen about 6 years ago
- File edisp_South_5h_nosmooth.png added
- File edisp_South_5h_smooth.png added
- File edisp_South_5h_1TeV_nosmooth.png added
- File edisp_South_5h_1TeV_smooth.png added
- File edisp_South_5h_0.1TeV_nosmooth.png added
- File edisp_South_5h_0.1TeV_smooth.png added
- File edisp_South_5h_10TeV_nosmooth.png added
- File edisp_South_5h_10TeV_smooth.png added
- % Done changed from 20 to 30
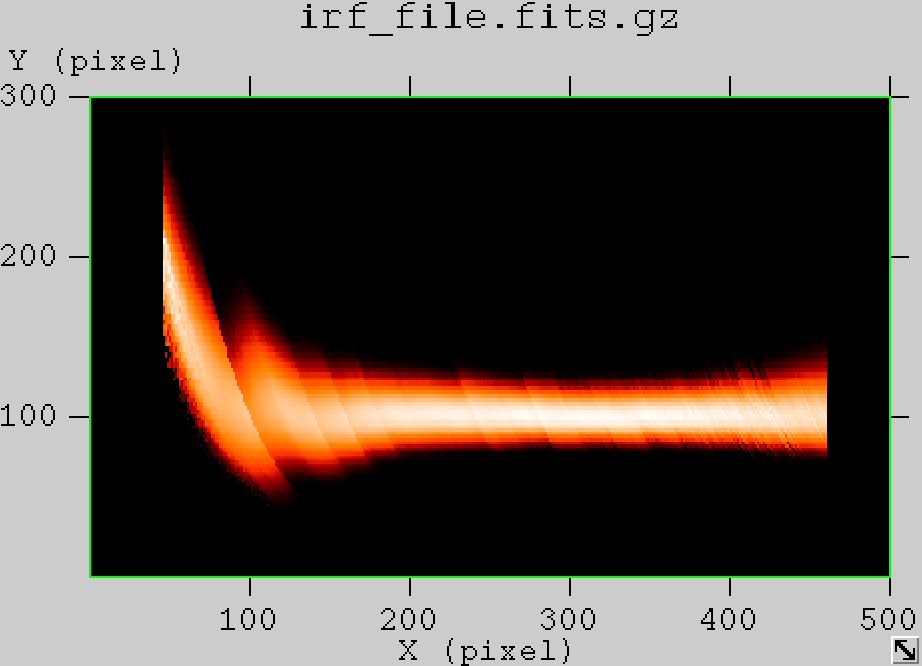
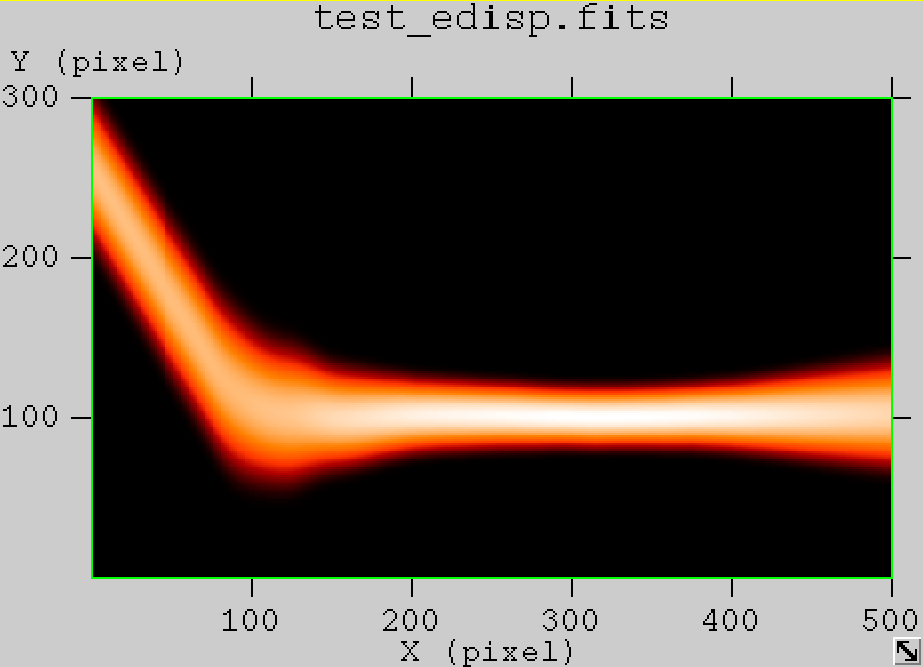
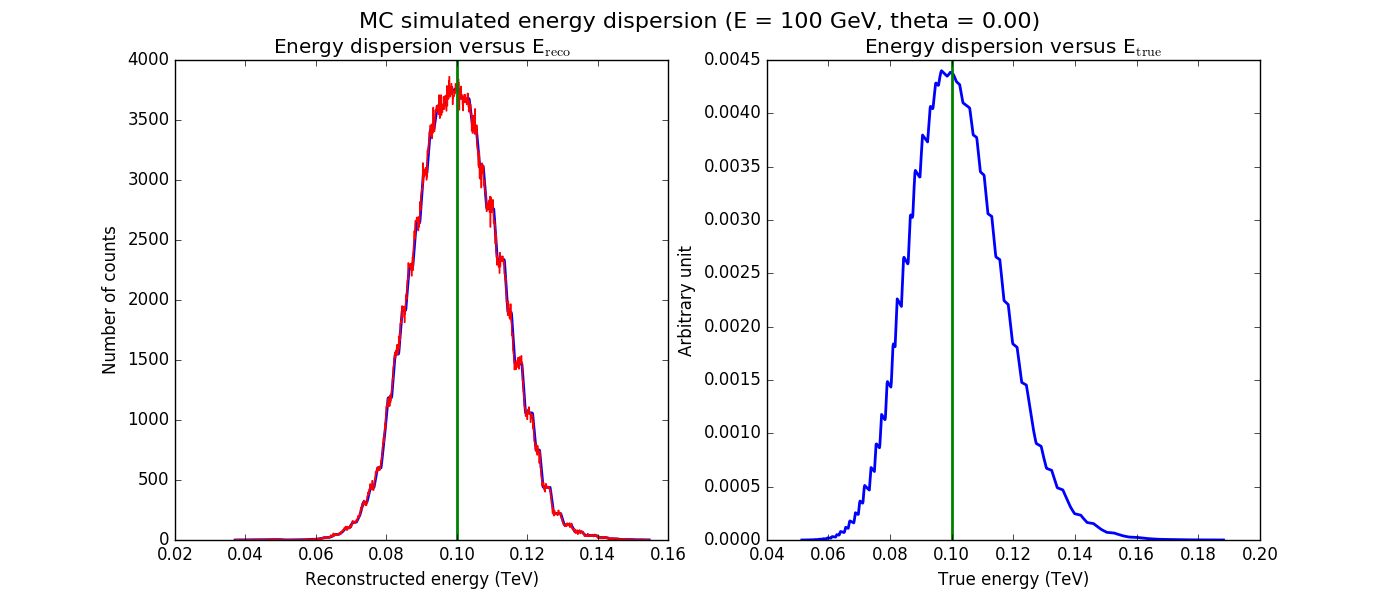
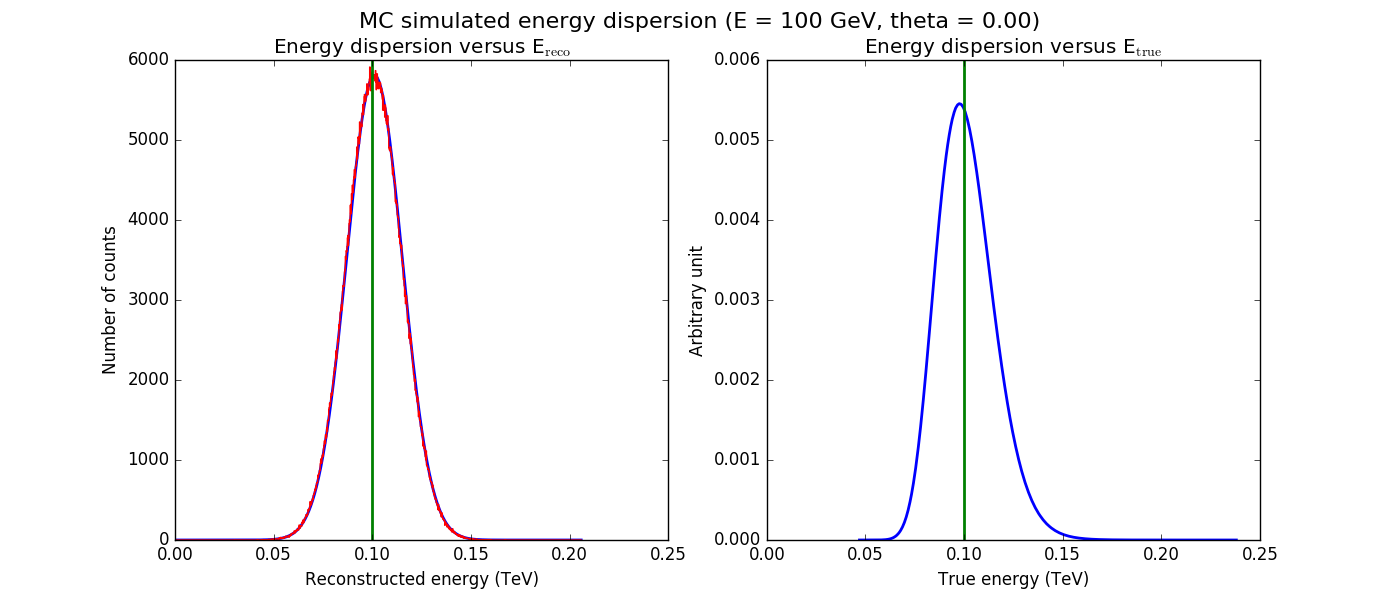
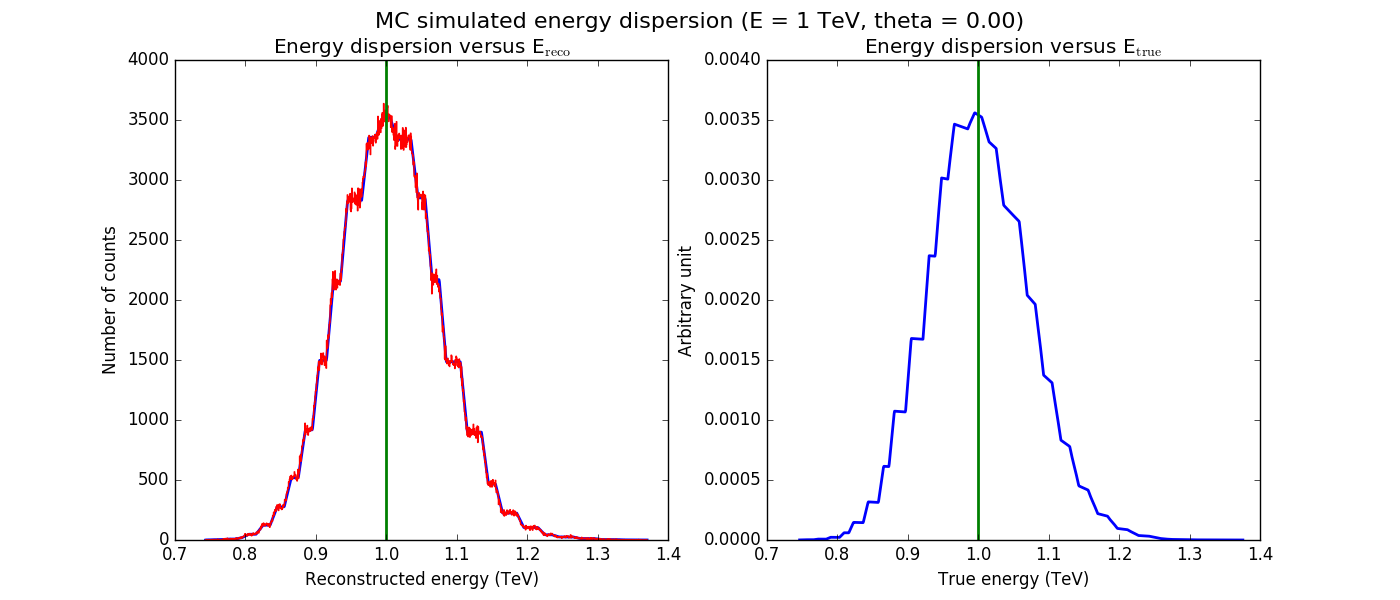
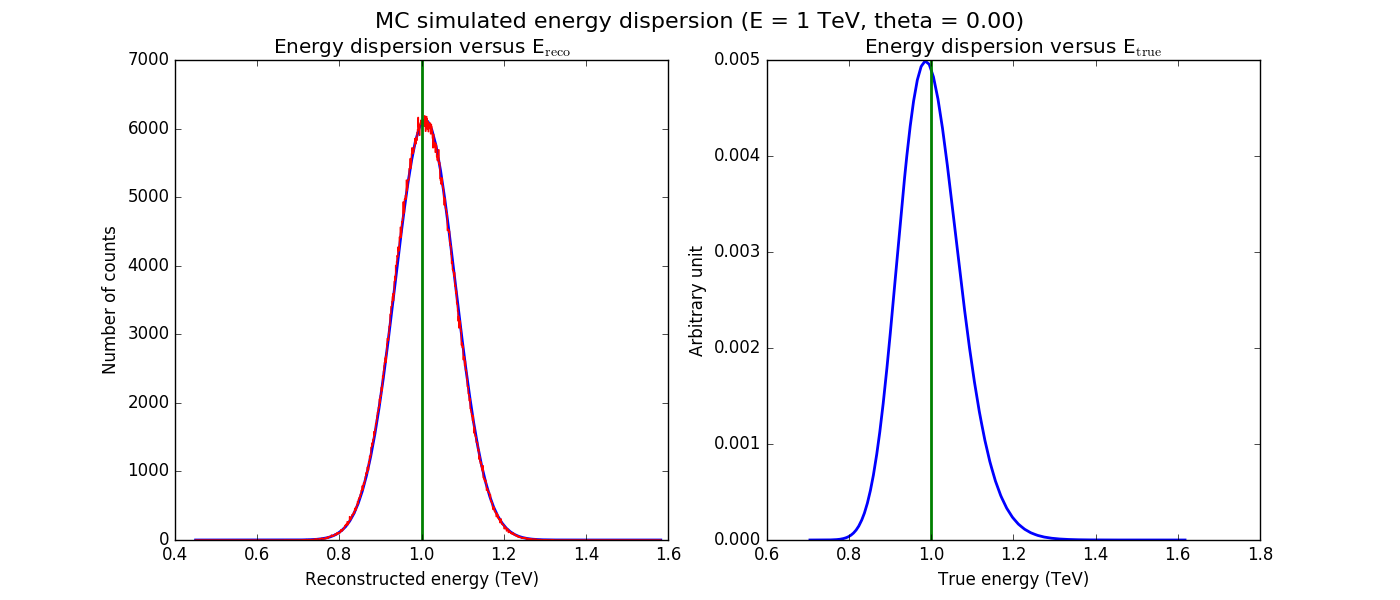
The figures below show the original (left) and smoothed (right) energy dispersion for the Prod2 South_5h IRF. The original IRF is irregular, but the smoothed IRF certainly poorly captures what happens at the low energy end. Below the 2D figures a comparison between the MC simulation and the model (left panels) and the true energy PDF (right panel). Not obvious why the smoothed IRF does not correctly reproduce the simulations.
 |
 |
 |
 |
 |
 |
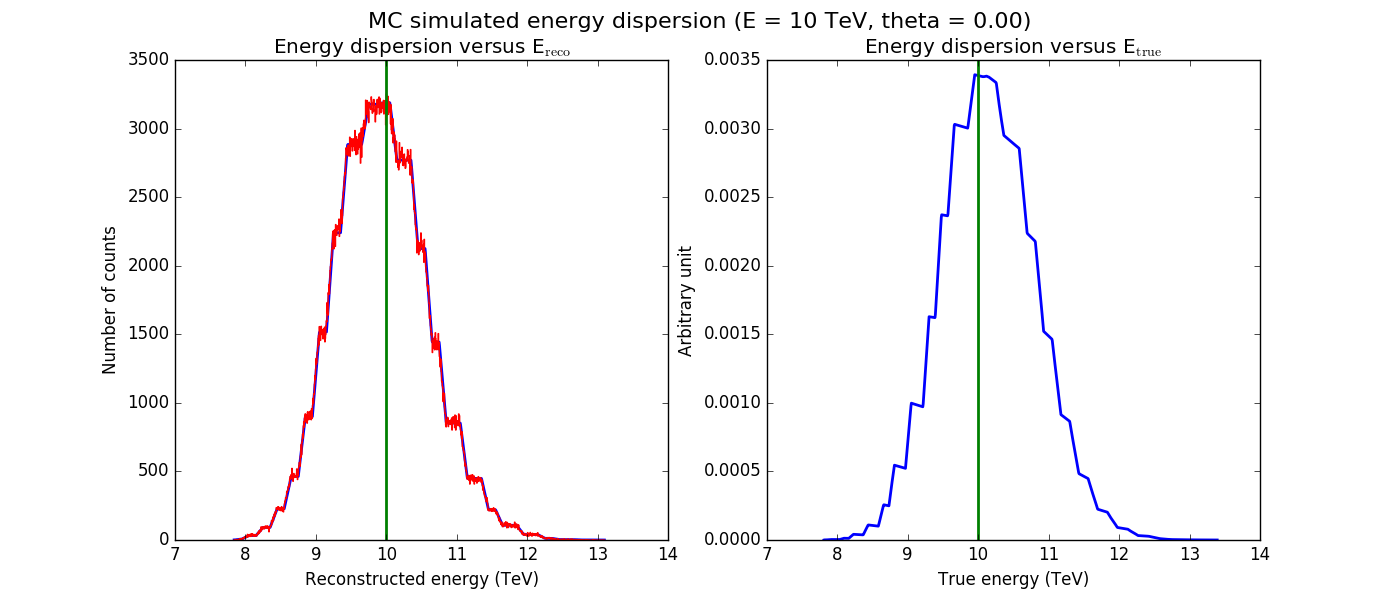 |
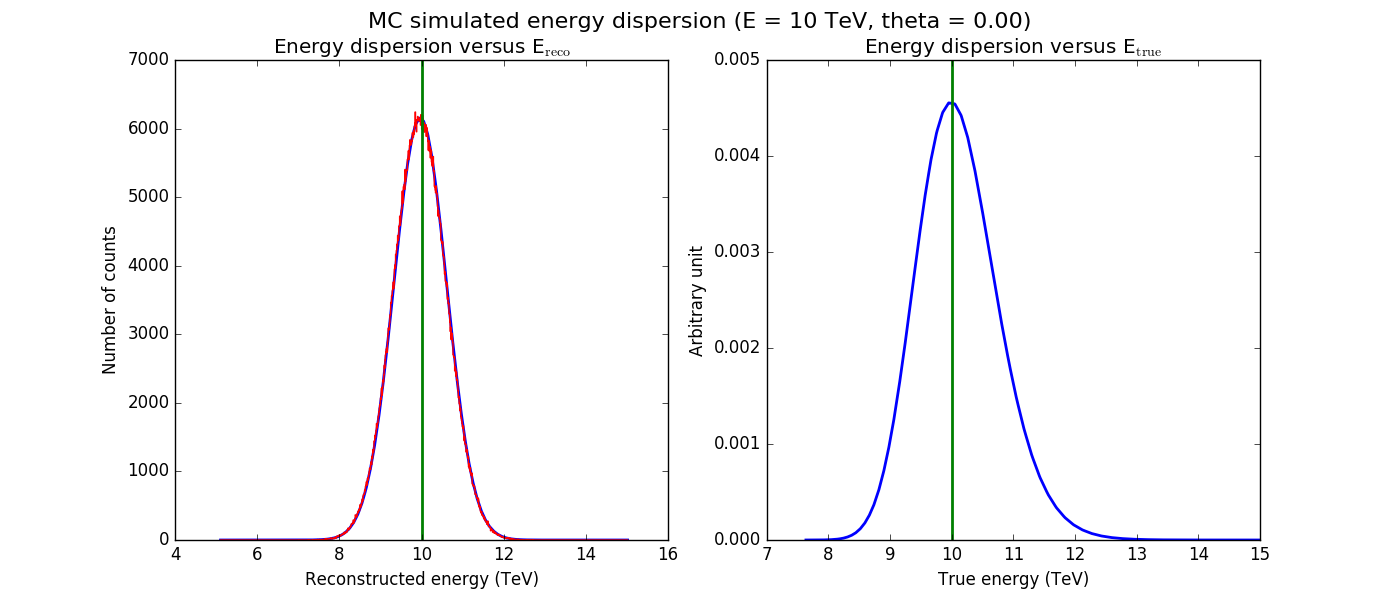 |
#5
 Updated by Knödlseder Jürgen about 6 years ago
- File show_model_mc.py
 added
added - File model_mc_South_50h_noedisp.png added
- File model_mc_South_50h_edisp-nosmooth.png added
- File model_mc_South_50h_edisp-smooth.png added
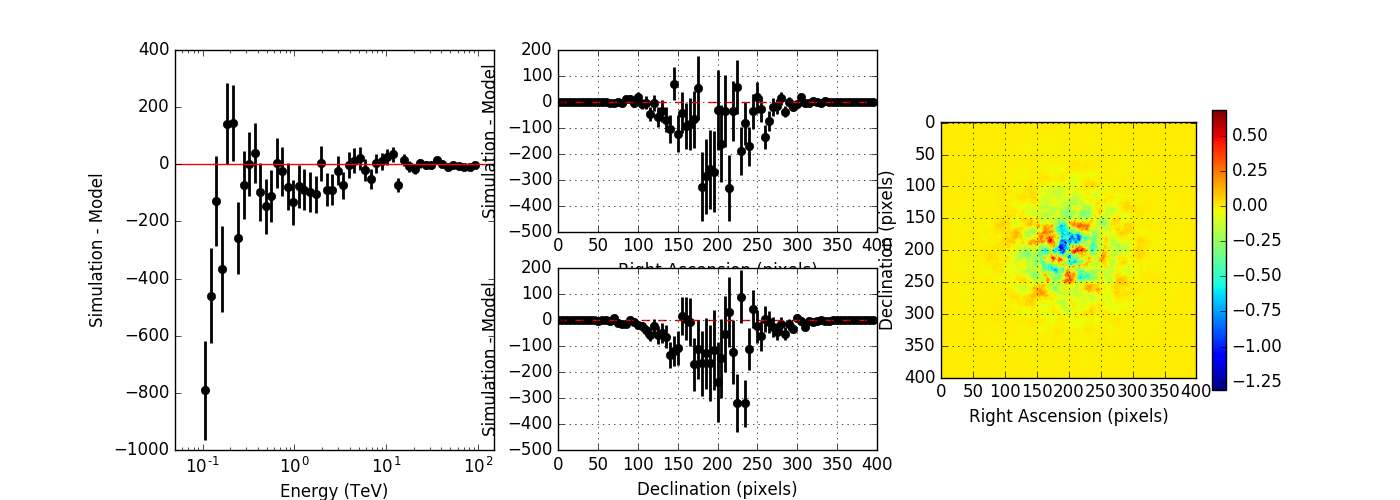
I created a script to compare the simulated event distribution to the modeled one (show_model_mc.py).
Below the results for a run without energy dispersion (top panel), with energy dispersion but no smoothing (mid panel), and with energy dispersion and smoothing (bottom panel). The simulation was done for 50h of the Crab nebula, Prod2 South_50h IRF.
Without energy dispersion, everything looks reasonable.
With energy dispersion but no smoothing, there are spectral outliers. Such spectral outliers were also observed for the 1DC data, and for exactly that reason, the smoothing was introduced.
With energy dispersion and smoothing the spectral outliers are gone, but now the low energy points are negative, i.e. there are more modeled than simulated events.
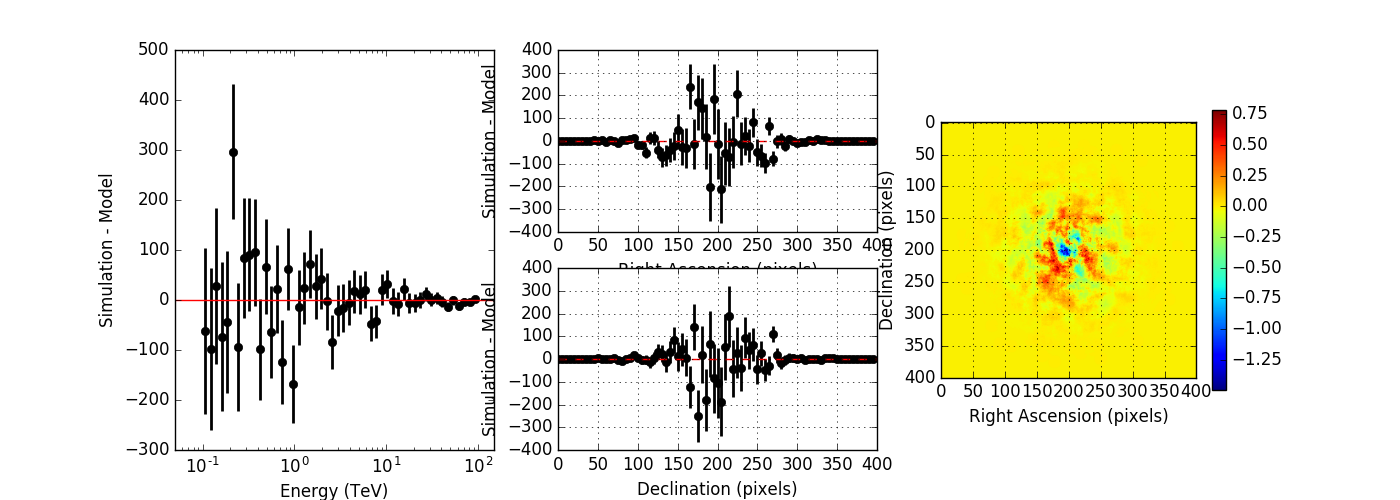 |
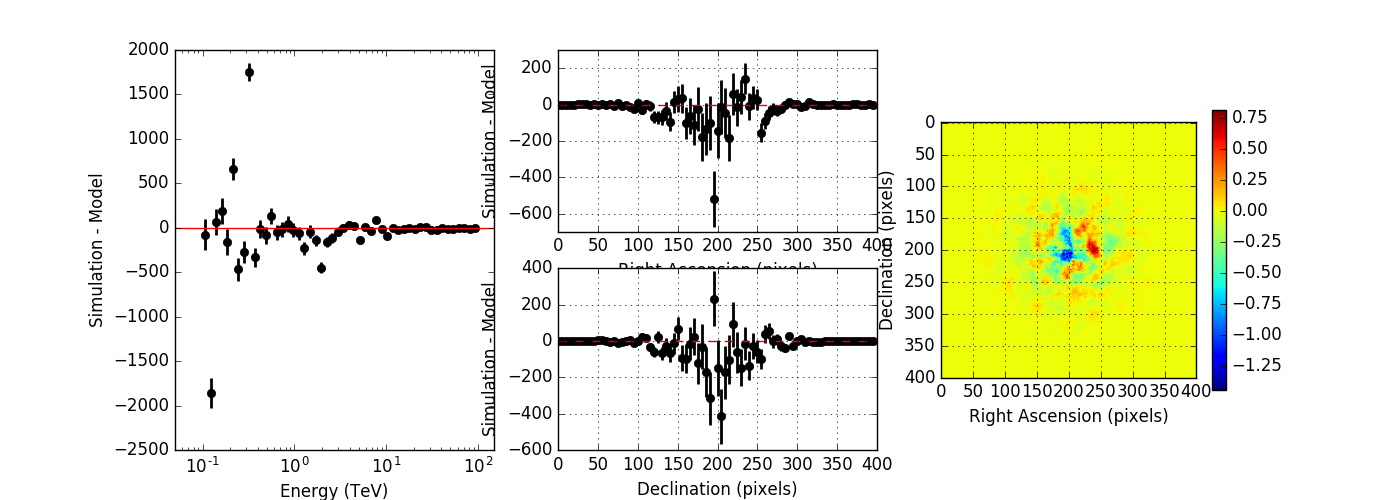 |
 |
#6
 Updated by Knödlseder Jürgen about 6 years ago
- File model_mc_South_50h_edisp-smooth_iter7.png added
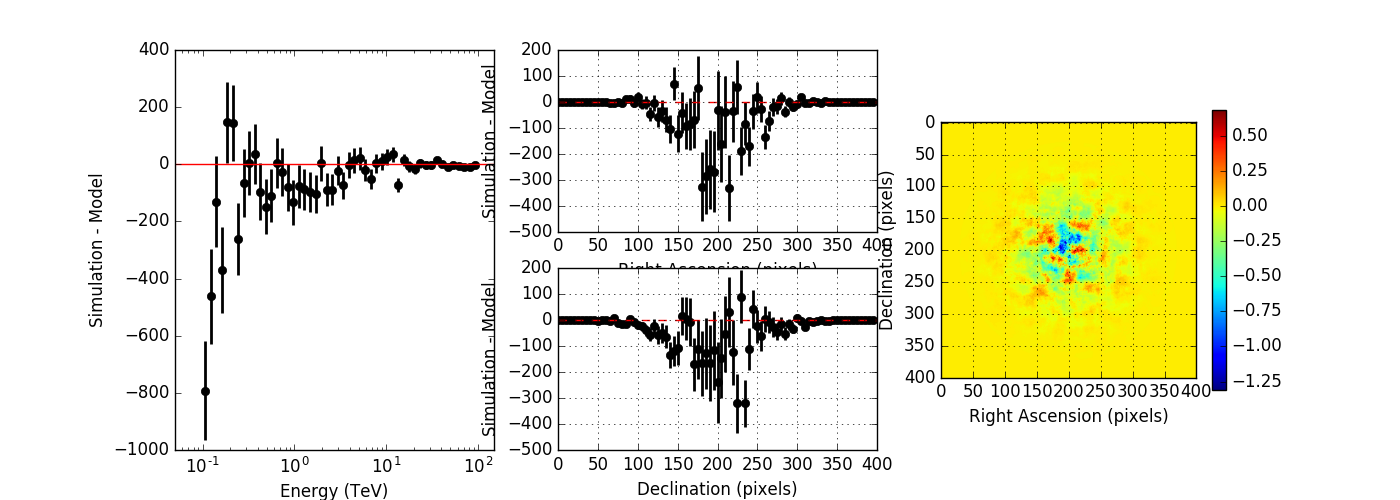
I checked whether the integration precision in GResponse::convolve has an impact on the result by setting iter=7 instead of the default iter=6. The top panel below shows the result for iter=7, the bottom panel for iter=6. No significant difference is observed.
 |
 |
#7
 Updated by Knödlseder Jürgen about 6 years ago
- File model_mc_South_50h_edisp-smooth_linint.png added
- File crab_prefactor.png added
- File crab_index.png added
- File bkg_prefactor.png added
- File bkg_index.png added
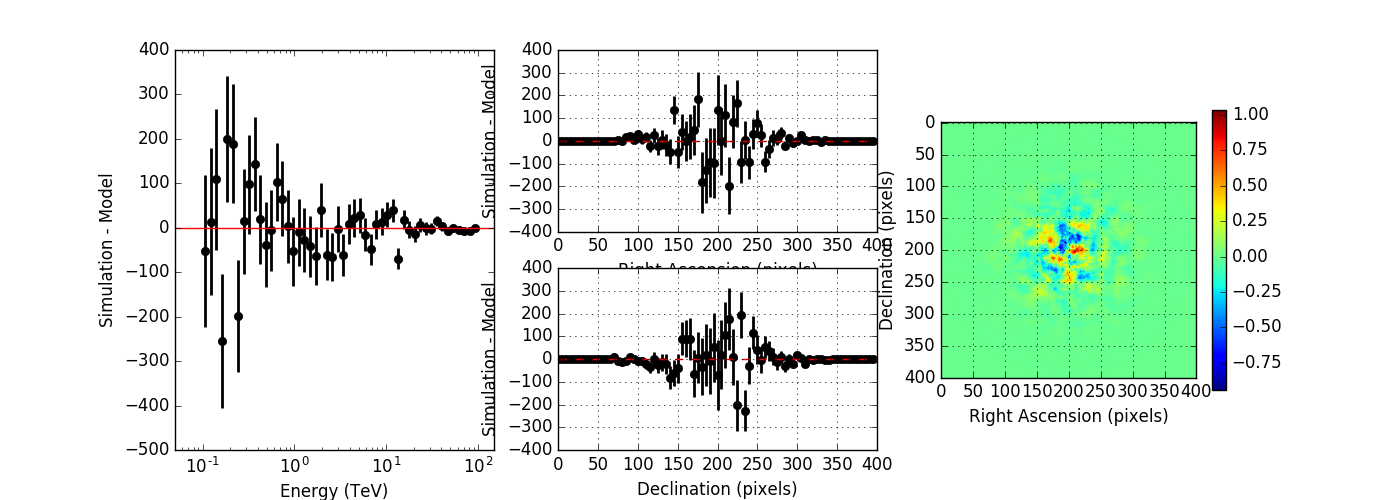
So far the energy dispersion integration is done in logarithmic energy, but since now everything is per linear energy the integration should probably also be done in linear energy. I changed the code in GResponse::convolve to linear energy and run again the computations for iter=6. Below the result (top panel) in comparison to the logarithmic integration (bottom panel). Things look much better now.
 |
 |
After having changed also the energy dispersion integration in GCTAResponseIrf::nroi and cta_nroi_kern::eval to linear (this is needed for an unbinned analysis), the science verification succeeds:
Test power law model with energy dispersion: ......... ok
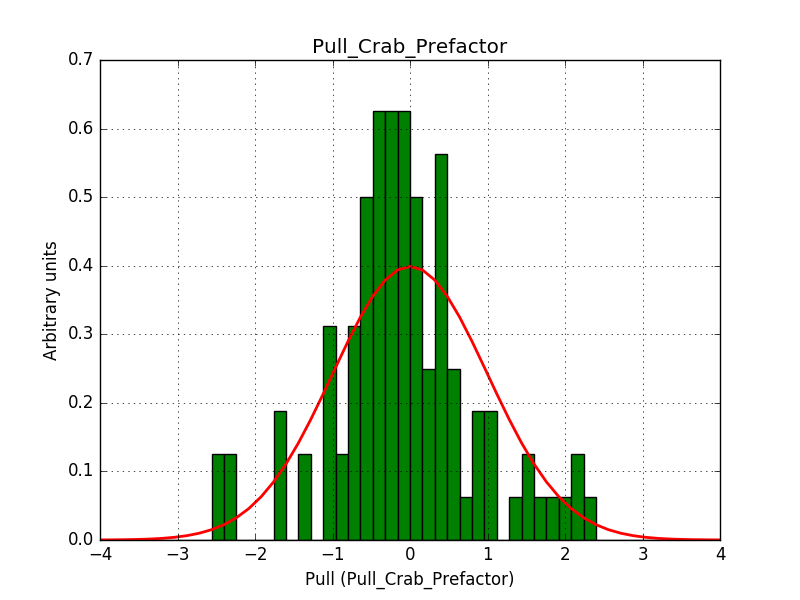
This solves that issue. The pull histograms below confirm that everything is okay.
 |
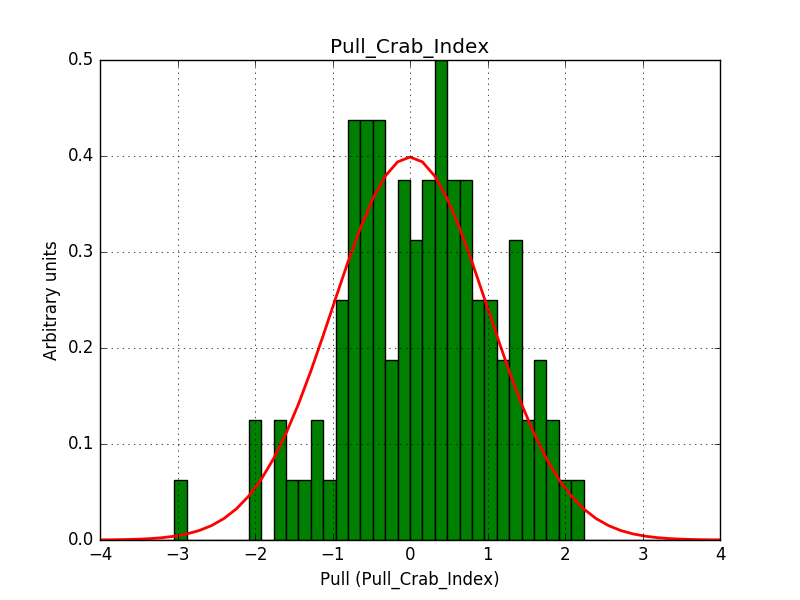 |
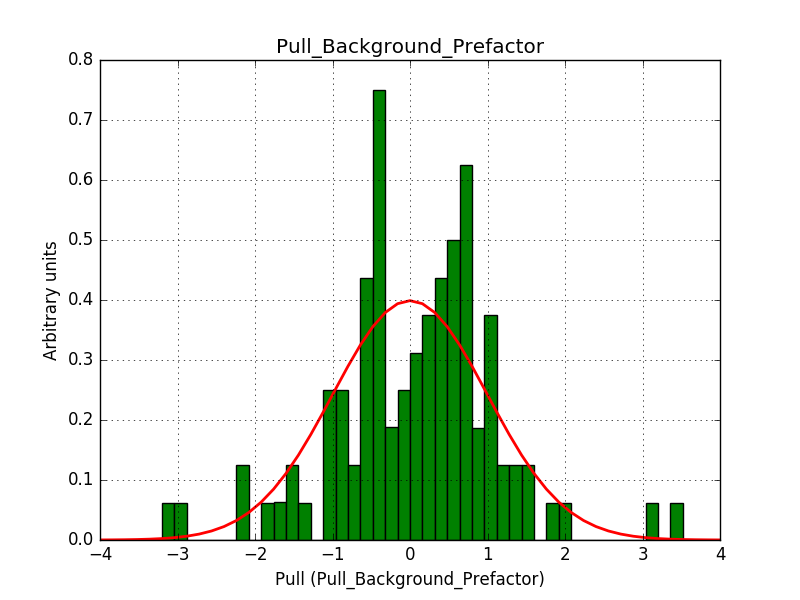 |
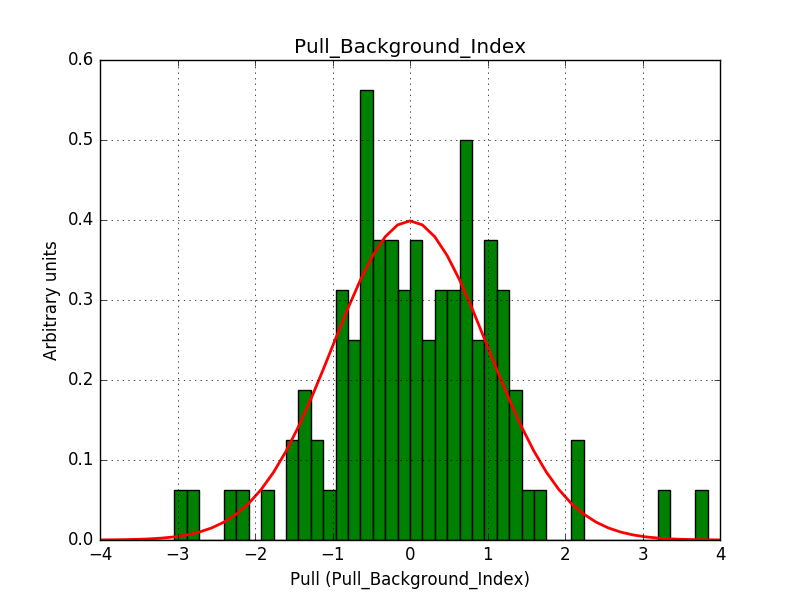 |
#8
 Updated by Knödlseder Jürgen about 6 years ago
- File stacked_crab_prefactor.png added
- File stacked_crab_index.png added
- File stacked_bkg_prefactor.png added
- File stacked_bkg_index.png added
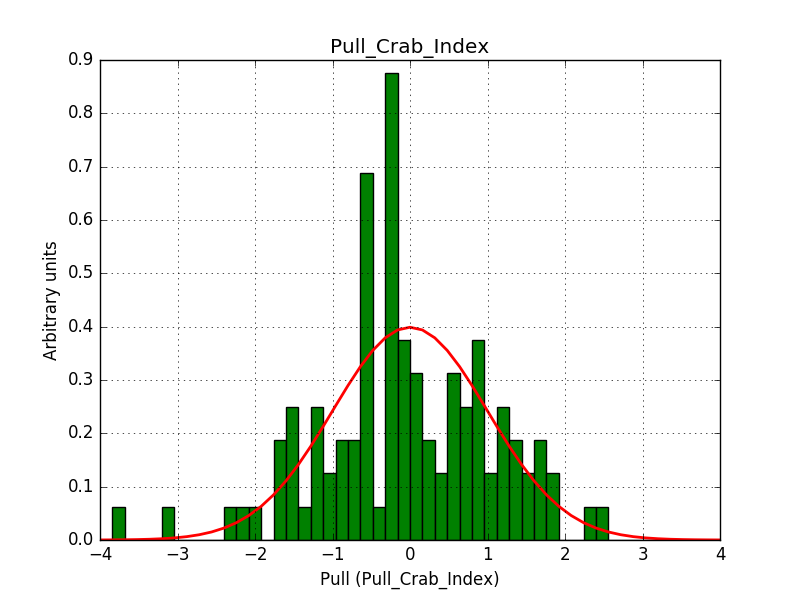
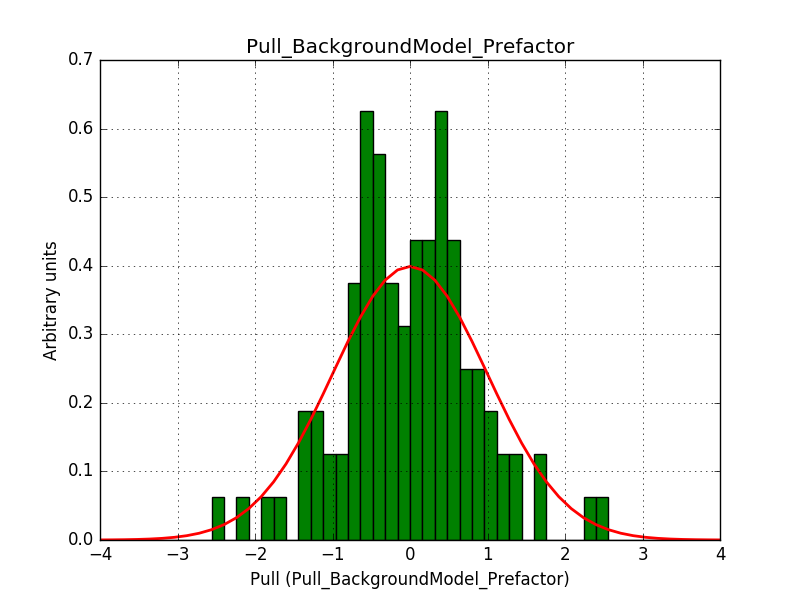
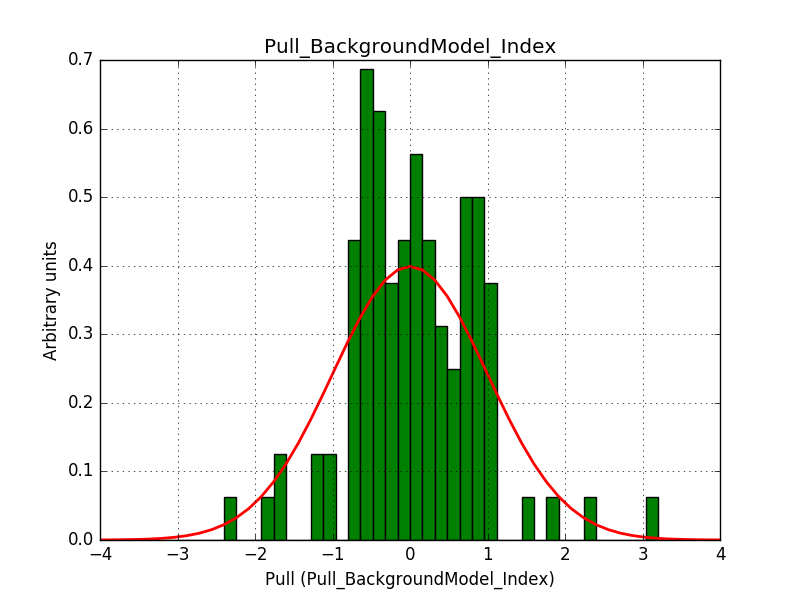
ctbinno longer computed the average pointing direction for a stacked cube ifusepnt=yes. I added some code so that the average pointing direction is computed as before.obsutils.sim()did not pass a counts cube to the response computation, and consequently the background cube was not correctly weighted. I changed this and added the change request #2763 that imposes usage of a counts cube
After these changes the science verification works:
Test power law model with stacked analysis: ......... ok
The corresponding pull histograms are below.
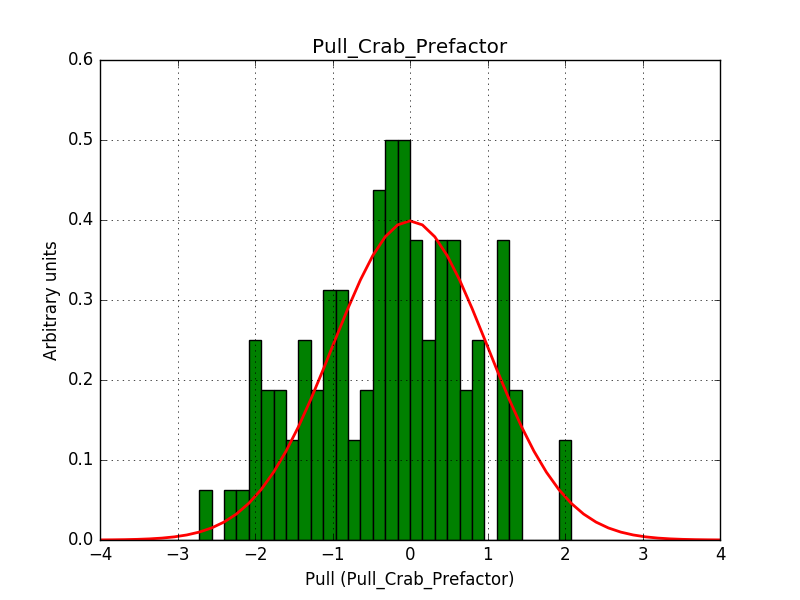 |
 |
 |
 |
#9
 Updated by Knödlseder Jürgen about 6 years ago
Here the results now for the science verification:
*******************************
* ctools science verification *
*******************************
Test background model: ..... ok
Test power law model: ......... ok
Test power law model with energy dispersion: ......... ok
Test power law model with stacked analysis: ......... ok
Test power law model with On/Off analysis: ......... ok
Test power law 2 model: ......... ok
Test smoothly broken power law model: ............. ok
Test exponentially cut off power law model: ........... ok
Test super exponentially cut off power law model: ............. ok
Test log parabola model: ........... ok
Test Gaussian model: ........... ok
Test file function model: ....... ok
Test nodes model: ............. ok
Test exponential model: ........... ok
Test point source model: ............. ok
Test radial disk model: ............... ok
Test radial Gaussian model: ............... ok
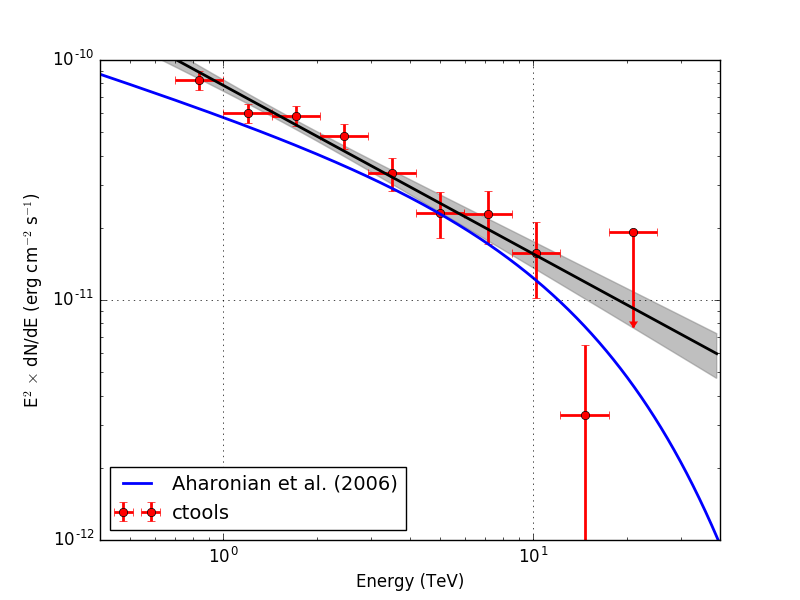
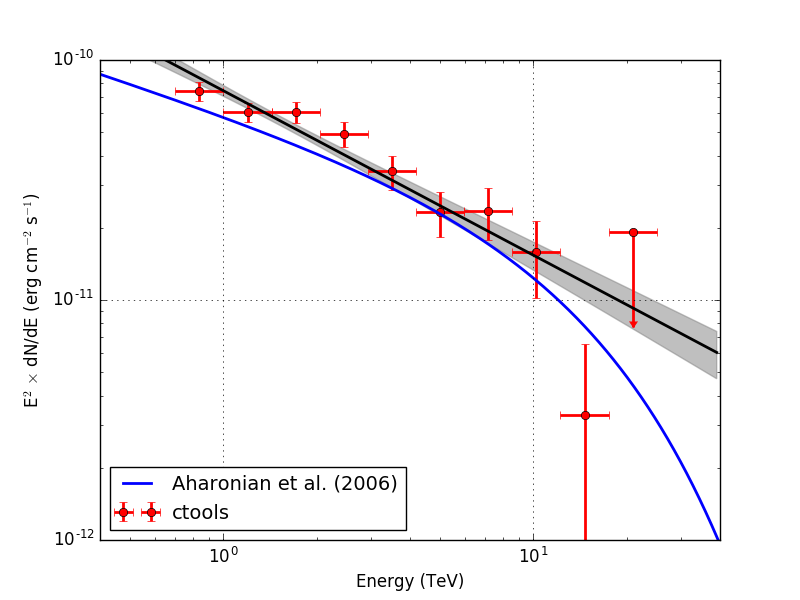
I also redid the H.E.S.S. DR1 results for the Crab using the new code. Below are the results for the unbinned and stacked analysis.
| Analysis | Edisp | logL | TS | Prefactor | Index | CPU |
| Unbinned | No | 98199.437 | 2025.108 | 4.892e-17 +/- 2.678e-18 | 2.702 +/- 0.066 | 70.6 |
| Unbinned | Yes | 98200.378 | 2023.226 | 4.648e-17 +/- 2.433e-18 | 2.685 +/- 0.068 | 167.1 |
| Stacked (40) | No | 54060.794 | 1872.940 | 4.637e-17 +/- 2.718e-18 | 2.675 +/- 0.071 | 152.2 |
| Stacked (40) | Yes | 54062.340 | 1869.847 | 4.308e-17 +/- 2.416e-18 | 2.639 +/- 0.074 | 4500.4 |
For reference, here are the results obtained earlier. It is not unexpected that the results with energy dispersion change, since this is the part of the code that was corrected.
| Analysis | Edisp | logL | TS | Prefactor | Index | CPU |
| Unbinned | No | 98199.437 | 2025.108 | 4.892e-17 +/- 2.678e-18 | 2.702 +/- 0.066 | 48.7 |
| Unbinned | Yes | 98196.591 | 2030.800 | 4.148e-17 +/- 2.005e-18 | 2.734 +/- 0.070 | 116.4 |
| Stacked (40) | No | 54060.675 | 1872.846 | 4.637e-17 +/- 2.718e-18 | 2.675 +/- 0.071 | 69.2 |
| Stacked (40) | Yes | 54059.739 | 1874.717 | 3.918e-17 +/- 2.022e-18 | 2.698 +/- 0.076 | 2737.0 |
#10
 Updated by Knödlseder Jürgen about 6 years ago
- File crab_sed.png added
- File crab_sed_edisp.png added
Below the resulting Crab SED. On the left without energy dispersion, on the right with energy dispersion.
 |
 |
#11
 Updated by Knödlseder Jürgen about 6 years ago
- Status changed from In Progress to Closed
- % Done changed from 30 to 100
Code was merged into devel.


