Feature #2723

Add example script to show significance distribution in significance map
| Status: | Closed | Start date: | 11/07/2018 | |
|---|---|---|---|---|
| Priority: | Normal | Due date: | ||
| Assigned To: |  Specovius Andreas Specovius Andreas | % Done: | 100% | |
| Category: | - | Estimated time: | 10.00 hours | |
| Target version: | 1.6.0 | |||
| Duration: |
Description
It would be nice to have an example script show_significance_distribution.py that can quickly show the distribution of significance values in a given significance map.
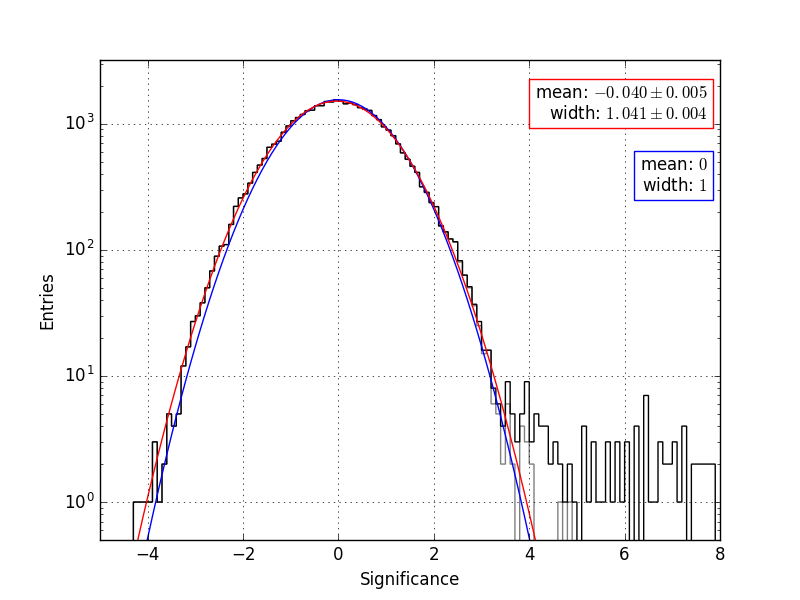
It should also be possible to exclude known sources so that the distribution of the significances of the source-free regions can be analysed. This could be fitted using a gaussian to give the user a measure at hand.
distribution.png (49.6 KB)
Recurrence
No recurrence.
Related issues
History
#1
 Updated by Specovius Andreas over 6 years ago
- Status changed from New to Feedback
- % Done changed from 0 to 90
I implemented an example script for that purpose. The script is in my gitlab repository in the corresponding branch and ready for review.
Currently the user can steer the script via the following parameters:- mapfile (mandatory, no default value): Path to the significance map to analyse.
- nbins (default 130): Number of bins for histogram.
- smin (default -5): Lower boundary of histogram sigma axis.
- smax (default 8): Upper boundary of histogram sigma axis.
- include (default empty string): Path to map masking the sky area(s) to include in the analysis. This can be used for specifying the roi.
- exclude (default empty string): Path to map or ds9 region file masking the sky area(s) to exclude from the analysis. This can be used to exclude known source regions. If an exclusion map is provided a fit of a normal distribution to the significance data surviving the exclusions is performed and the results are printed in the plot.
- p (default empty string): Storage path for figure. If provided the plot will not be shown.
#2
Updated by Specovius Andreas over 6 years ago
- Status changed from Feedback to In Progress
- % Done changed from 90 to 80
Note that currently the scipy module is used for fitting the normal distribution to the significance histogram, which is obviously not allowed. Have to implement fitting without scipy.
Put back issue to in progress.
#3
Updated by Specovius Andreas over 6 years ago
Currently it is not possible to use the gammalib optimizer from within python. I created the dedicated issue #2733 for that. Until that is implemented this issue is stalled.
#4
Updated by Specovius Andreas over 6 years ago
- Blocked by Feature #2733: Make function fitting with GOptimizer possible for python scripts added
#5
 Updated by Knödlseder Jürgen about 6 years ago
I’m currently working on merging in the script, using the GammaLib optimizer. Do you have some example files that I can use for testing?
#6
Updated by Knödlseder Jürgen about 6 years ago
- File distribution.png added
Here is what I get for a standard Crab run sky map, generated with ctskymap, and using:
$ show_significance_distribution.py skymap.fits --exclude skymap.fits[EXCLUSION]

#7
Updated by Knödlseder Jürgen about 6 years ago
- Status changed from In Progress to Closed
- % Done changed from 80 to 100
Merged into devel.