Support #3135

CTAIrfBackground + ctulimit error
| Status: | Closed | Start date: | 01/13/2020 | |
|---|---|---|---|---|
| Priority: | Normal | Due date: | ||
| Assigned To: |  Tibaldo Luigi Tibaldo Luigi | % Done: | 100% | |
| Category: | - | |||
| Target version: | - | |||
| Duration: |
Description
Hello! I am facing problems when using ctulimit for Dark Matter and it seems it is related with the CTAIrfBackground. It is only possible to generate events with ctobssim when I use 5h of observation, while I would need 500h (100h, 300h and 50h give allocation problems). After generating the events, I bine them and then I use ctulimit. However it always gives me error as seen in ctulimit.log. When I incrase the maximum value of the parameter, the problem still continues and it goes infinitely. Why is this happening? When I do this process without the background it works fine only sometimes, other times, even with 5h of observation, I get bad allocation and ctulimit problems.
ctools version: 1.6.3
caldb: prod3b-v2
irf: South_z20_50h
ctbin.log (4.1 KB)
ctobssim.log (12.3 KB)
ctulimit.log (7.1 KB)
subh2.xml  (975 Bytes)
energy_flux.txt
- needed for FIleFunction (xml file)
(29.8 KB)
Figure_1.png (51.5 KB)
energy_flux.eps (1.79 MB)
crab_compare.png (20 KB)
test.py
(2.52 KB)
ctulimit.log (15.1 KB)
changes.log (584 Bytes)
subh2.xml
(980 Bytes)

Recurrence
No recurrence.
History
#1
 Updated by Kherlakian M. about 5 years ago
- Assigned To set to Knödlseder Jürgen
#2
 Updated by Tibaldo Luigi about 5 years ago
- File Figure_1.png added
- Assigned To changed from Knödlseder Jürgen to Tibaldo Luigi
- I assume that energy_flux.txt should be your expected DM source spectrum? I tried to plot it and I got something that does not make any sense to me

The order of magnitude is 10^20 brighter than the Crab nebula. Therefore I suspect that there is a mistake in the way you prepared the input spectrum. The file must contain two columns: 1) energy in MeV, 2) differential photon flux in photons/cm2/s/MeV (http://cta.irap.omp.eu/ctools/users/user_manual/models_spectral.html#file-function). Could you please verify that this is the case or make the necessary modifications? - “It is only possible to generate events with ctobssim when I use 5h of observation, while I would need 500h (100h, 300h and 50h give allocation problems”. If you get memory allocation problems you must be trying to simulate long observations with a single pointing. This is not realistic: the duration of a night sets an upper limit to the duration of an observation of order ~10h. To simulate long observations (hundred hours) you should split them in multiple pointings of a few hours each. To this end you can use csobsdef to generate an observation definition file to pass in input to ctobssim: http://cta.irap.omp.eu/ctools/users/reference_manual/csobsdef.html
- Also note that you are ignoring energy dispersion, which will make the results less accurate. Once the problems above are solved, please make sure to switch on energy dispersion for your final runs.
#3
Updated by Kherlakian M. about 5 years ago
- File energy_flux.eps added
Tibaldo Luigi wrote:
Dear Tibaldo Luigi. Thank you for your answer. I have still have some questions.
- I assume that energy_flux.txt should be your expected DM source spectrum? I tried to plot it and I got something that does not make any sense to me
Yes, it is my DM source spectrum. These values correspond to a velocity-averaged annihilation cross-section of 1 cm^3/s. I set it to this value and then at the xml file I define a parameter of the order of 1e-28, which is more realistic to dark matter and would produce a faint differential flux (0 source photons when simulating events).
The order of magnitude is 10^20 brighter than the Crab nebula. Therefore I suspect that there is a mistake in the way you prepared the input spectrum. The file must contain two columns: 1) energy in MeV, 2) differential photon flux in photons/cm2/s/MeV (http://cta.irap.omp.eu/ctools/users/user_manual/models_spectral.html#file-function). Could you please verify that this is the case or make the necessary modifications?
I attached a figure showing the units of my txt inputs. They are energy in MeV and differential flux in 1/MeV/cm2/s (the particle physics multiplied by the astrophysics term). Concerning the units of photons/cm2/s/MeV, I think I didn’t understand what the unit of photons means. Is it the same as 1/cm2/s/MeV? Or should I do some rescaling to the differential flux? For example, multiplying it by some power of the energy as you did in your plot?
#4
Updated by Tibaldo Luigi about 5 years ago
The quantity in the second column should be dN/dS/dt/dE in photons/cm2/s/MeV or 1/cm2/s/MeV (photons are not a physical unit, I write it only to be clearer that it is a photon count spectrum).
I think there may be an error in the way you generate your txt file. The result for a reasonable dark matter model cannot be 10^20 brighter than the Crab nebula. Could you please plot the spectrum in your txt file overlaid to the spectrum of the Crab nebula/current DM limits and make sure it all makes sense?
#5
Updated by Kherlakian M. about 5 years ago
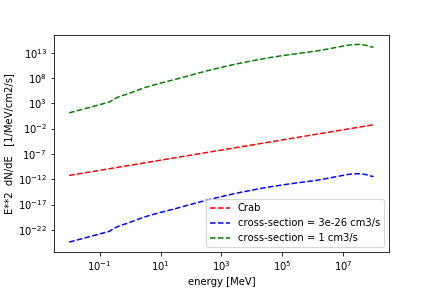
- File crab_compare.png added
Tibaldo Luigi wrote:
The quantity in the second column should be dN/dS/dt/dE in photons/cm2/s/MeV or 1/cm2/s/MeV (photons are not a physical unit, I write it only to be clearer that it is a photon count spectrum).
I think there may be an error in the way you generate your txt file. The result for a reasonable dark matter model cannot be 10^20 brighter than the Crab nebula. Could you please plot the spectrum in your txt file overlaid to the spectrum of the Crab nebula/current DM limits and make sure it all makes sense?
The green line has the values as printed in the energy_flux.txt file, the red line is the power-law spectrum expected for the Crab and the blue line is the expected DM spectrum. I think the problem is related to the normalization of my source spectrum. Since I want to know the upper limit value of the cross-section, I define a Nomalization of my source spectrum given by:
name="Normalization" scale="1e-26" value="0.01" min="0" max="5e5" free="0",
instead of multiplying it directly to the second input of the txt file. I think maybe that’s the problem.
#6
Updated by Kherlakian M. about 5 years ago
Tibaldo Luigi wrote:
The quantity in the second column should be dN/dS/dt/dE in photons/cm2/s/MeV or 1/cm2/s/MeV (photons are not a physical unit, I write it only to be clearer that it is a photon count spectrum).
I think there may be an error in the way you generate your txt file. The result for a reasonable dark matter model cannot be 10^20 brighter than the Crab nebula. Could you please plot the spectrum in your txt file overlaid to the spectrum of the Crab nebula/current DM limits and make sure it all makes sense?
Is it ok if I multiply the spectrum input of the txt by a power of 10 and then redefine my Normalization? For example, multiplying the spectrum by 1e-16 and defining the Normalization as
name="Normalization" scale="1e-10" value="0.01" min="0" max="5e5" free="0",
#7
Updated by Tibaldo Luigi about 5 years ago
- File test.py added
- File ctulimit.log added
- File changes.log added
- File subh2.xml added
I tried to replicate the problem, but in the process I discovered that the analysis had several suboptimal parameters, most importantly
- I fixed the position of the source
- I extended the energy range up to the maximum allowed by the IRFs since the maximum energy output from the source is at the highest energy
- I used a finer energy and spatial binning (the one originally used did not allow to properly sample model and IRFs)
- I reduced the size of the analysis region to 2x2 deg
Attached a Python script that performs the desired task for an observation time of 5h, and manages to compute the upper limit in a couple of minutes. I’m also attaching a detailed log of the changes I made to the analysis parameters, the modified XML file and output log file from ctulimit.
Maria could you please verify that with these changes you obtain reasonable results on your side too? For the moment please stick to short observations of 5 h max, we can discuss how to simulate larger datasets split in several pointings later.
#8
Updated by Kherlakian M. about 5 years ago
That solved the problem. Thank you!
#9
Updated by Tibaldo Luigi about 5 years ago
- Tracker changed from Bug to Support
- Priority changed from High to Normal
- % Done changed from 0 to 50
#10
Updated by Tibaldo Luigi about 5 years ago
- Status changed from New to Resolved
- % Done changed from 50 to 100
No more feedback from Maria, it looks like the problem was with the analysis configuration. Marking this as resolved
#11
 Updated by Knödlseder Jürgen almost 5 years ago
- Status changed from Resolved to Closed