Support #3178
Unusual clustering of results around 2 sigma significance
| Status: | In Progress | Start date: | 03/04/2020 | ||
|---|---|---|---|---|---|
| Priority: | High | Due date: | |||
| Assigned To: | - | % Done: | 10% | ||
| Category: | - | ||||
| Target version: | - | ||||
| Duration: |
Description
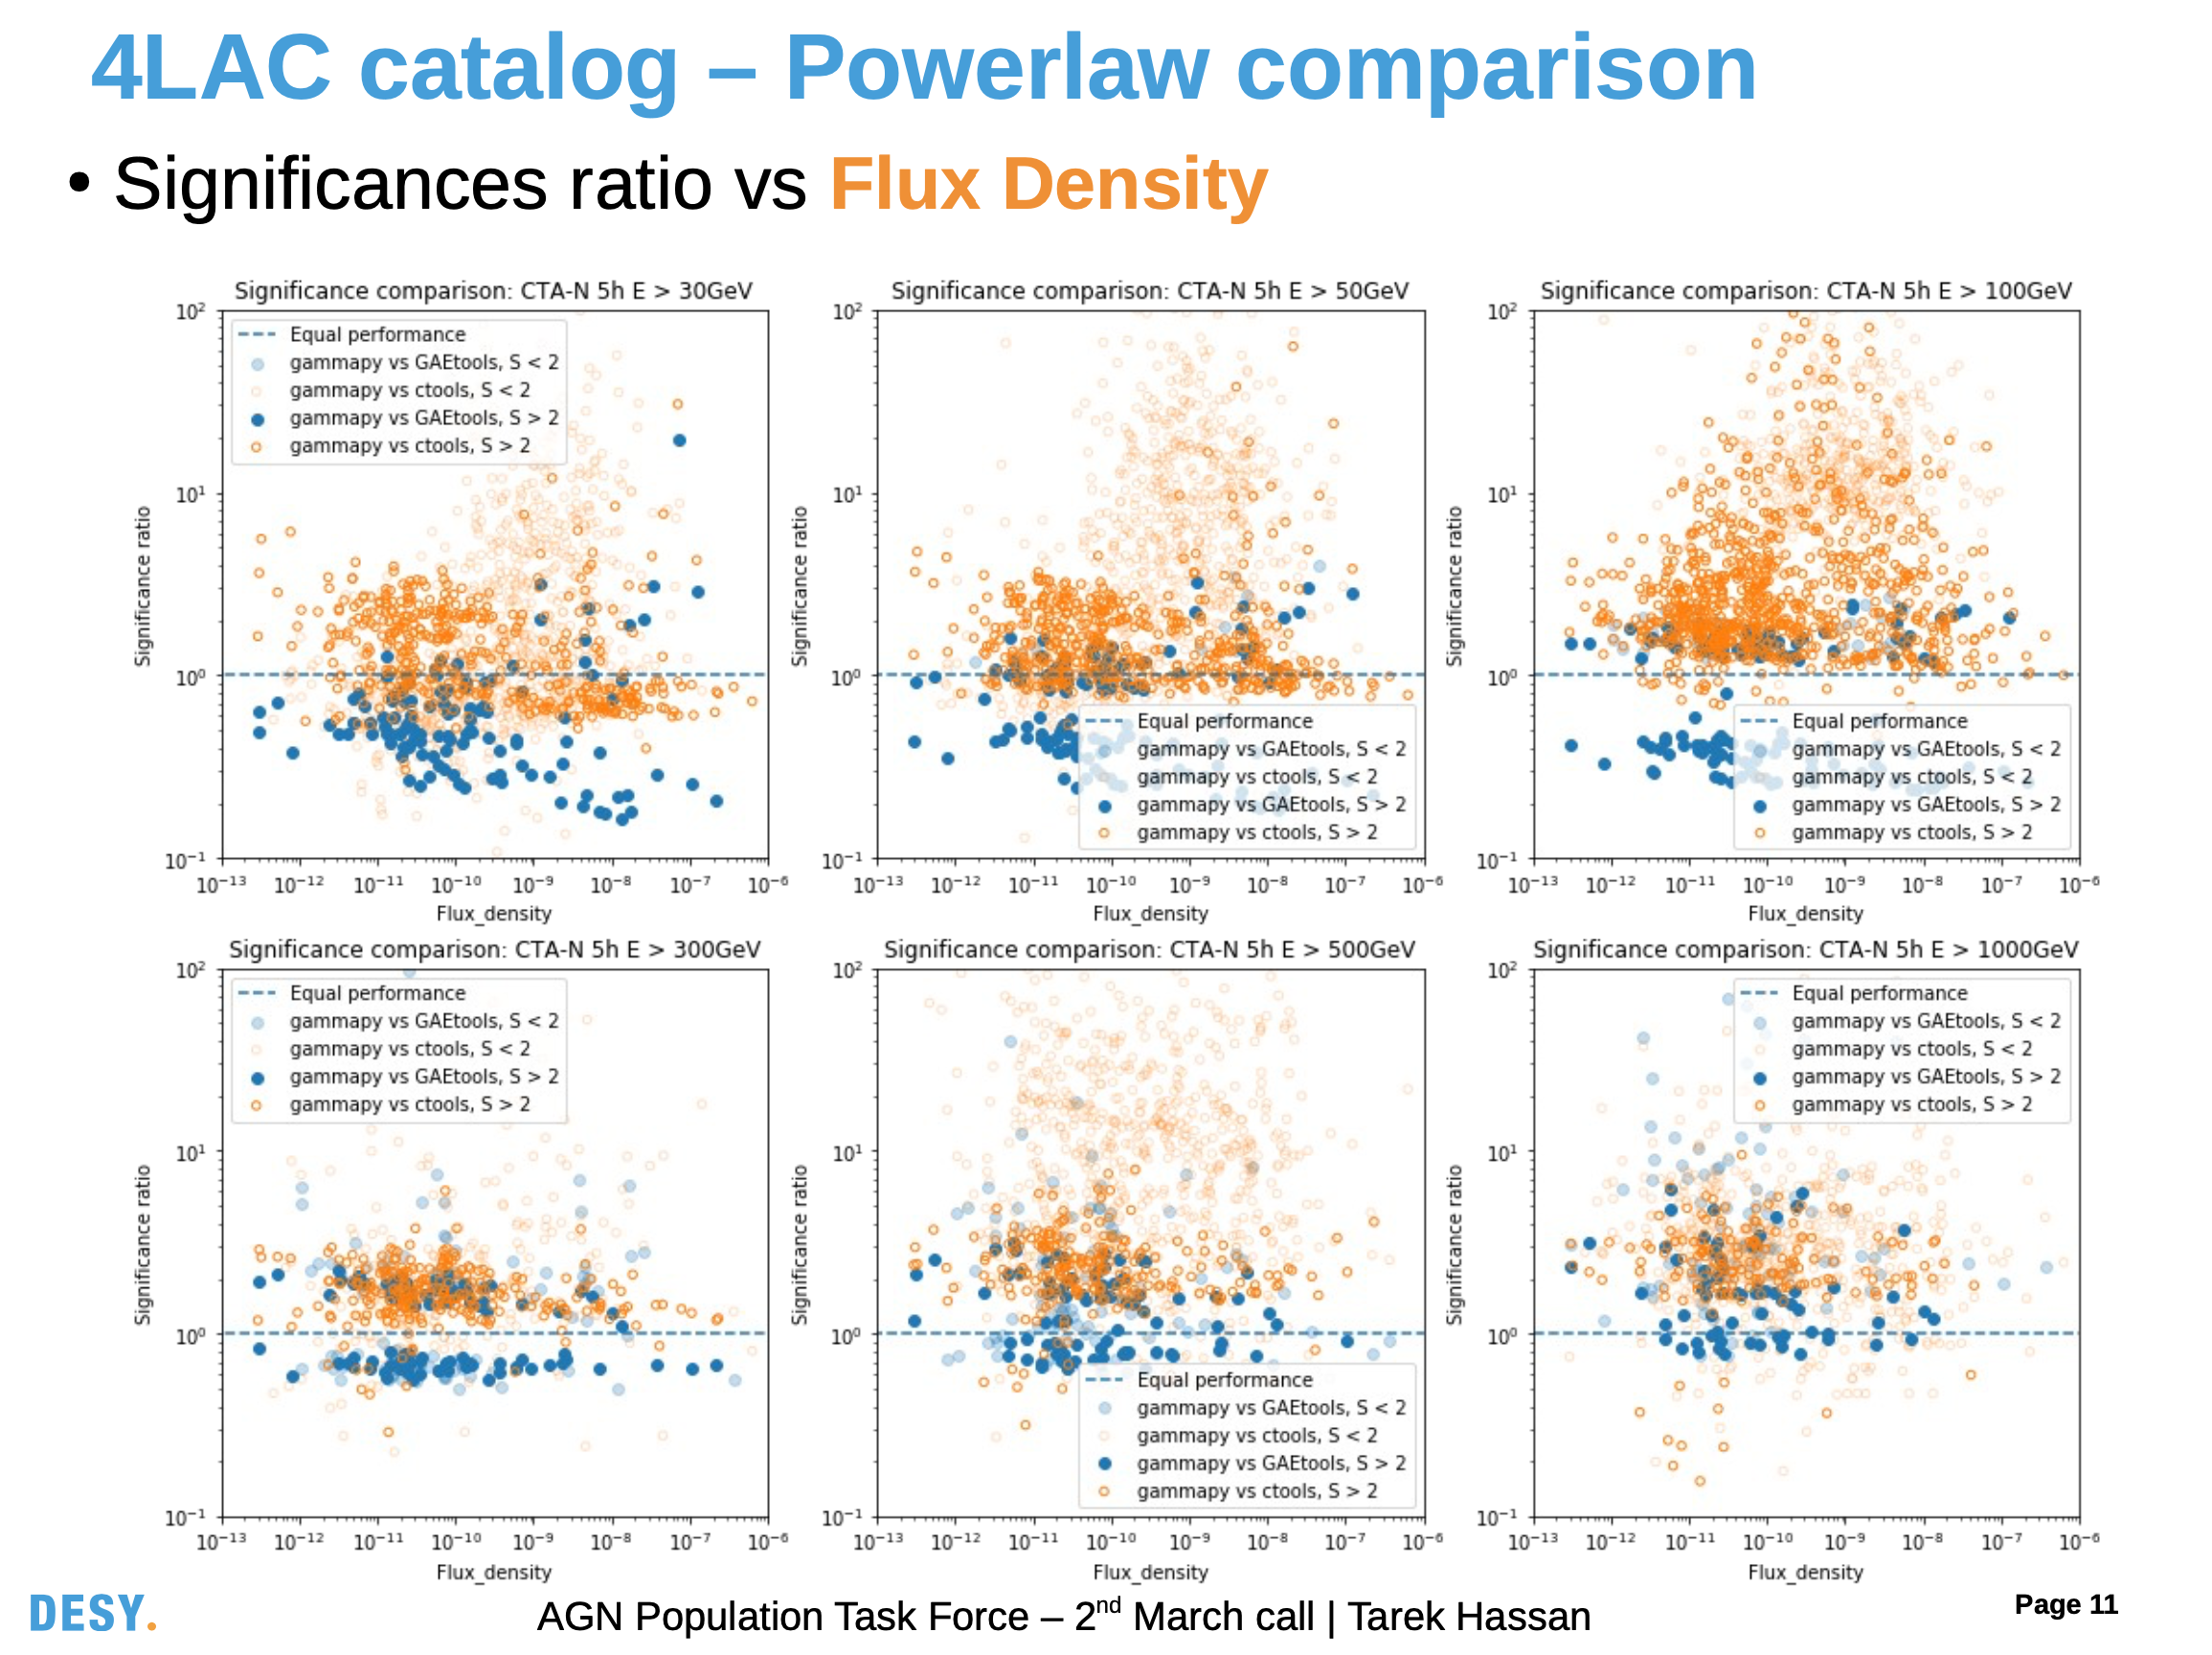
I have been doing ctools simulations for the AGN population task force led by Tarek Hassan. In this work we have been evaluating the significances of 1550 extragalactic sources for different energy thresholds. When comparing the significances I found (y axis) with those of gammapy(x axis), Tarek noticed that while the results are in general compatible, there is a weird clustering of of my results for the specific case of 100 GeV threshold (seen in topp right plot of comparison.png). I seem to be getting significances of 2 sigma for sources gammapy gets a 0.1-1 sigma significance.
Now this could be a result of the fact that the ctools analysis (which is 3D) being more sensitive than the 1D analysis done in gammapy. It might also have something to do with our different choice of backgrounds. It is a feature I would like to understand better and account for.
I have attached
i)the xml file for one of my sources
ii) the spectra data file it references
iii) the python script for my likelihood analysis at 30 GeV
Please let me know if there is anything else you need. Thanks in advance
Recurrence
No recurrence.
History
#1
 Updated by Tibaldo Luigi almost 5 years ago
Hi Atreya,
could you please post a plot where you show the significance obtained with ctools as a function of true source flux for the cases where you have the suspicious cluster?
#2
 Updated by Acharyya Atreya almost 5 years ago
- File significance_vs_flux.png added
Tibaldo Luigi wrote:
Hi Atreya,
could you please post a plot where you show the significance obtained with ctools as a function of true source flux for the cases where you have the suspicious cluster?
Thanks Luigi...here is a plot of the significance ratio between ctools significance and gammapy significance against the flux density of the sources. A significance ratio of 1 would be equal performance.
The orange circles are the ctools results with the darker shade indicating at least a significance of 2. The lighter shade indicates a significance less than 2.
The blue dots were the ratio of GAEtools and gammapy.
Once again the top right plot shows this unusual clustering and we did wonder if it has something to do with the brightness of the source.
#3
 Updated by Tibaldo Luigi almost 5 years ago
Hi Atreya, I would really like to see the ctools sognificance (not the ratio to the gammapy significance) versus integrated flux above the analysis threshold (not the flux density) please.
#4
 Updated by Acharyya Atreya almost 5 years ago
Tibaldo Luigi wrote:
Hi Atreya, I would really like to see the ctools sognificance (not the ratio to the gammapy significance) versus integrated flux above the analysis threshold (not the flux density) please.
Hi Luigi,
Sorry about that. I misunderstood.
I’m afraid I don’t think I have the numbers for integrated flux above the threshold.
I hadn’t included csspec or ctulimit for all my sources in the analysis (due to the large number of sources) and just used ctlike.
#5
 Updated by Tibaldo Luigi almost 5 years ago
Didn’t you save the results of the ctlike fit in an xml file?
There is no need to run csspec or ctulimit to have the integrated flux.
#6
 Updated by Tibaldo Luigi almost 5 years ago
- Tracker changed from Bug to Support
- Status changed from New to In Progress
- % Done changed from 0 to 10
#7
 Updated by Acharyya Atreya almost 5 years ago
- File flux_ts_irf_100gev.png added
- File TS_vs_time_weird.png added
- File flux_ts_irf_30gev.png added
UPDATE: 23rd March 2020
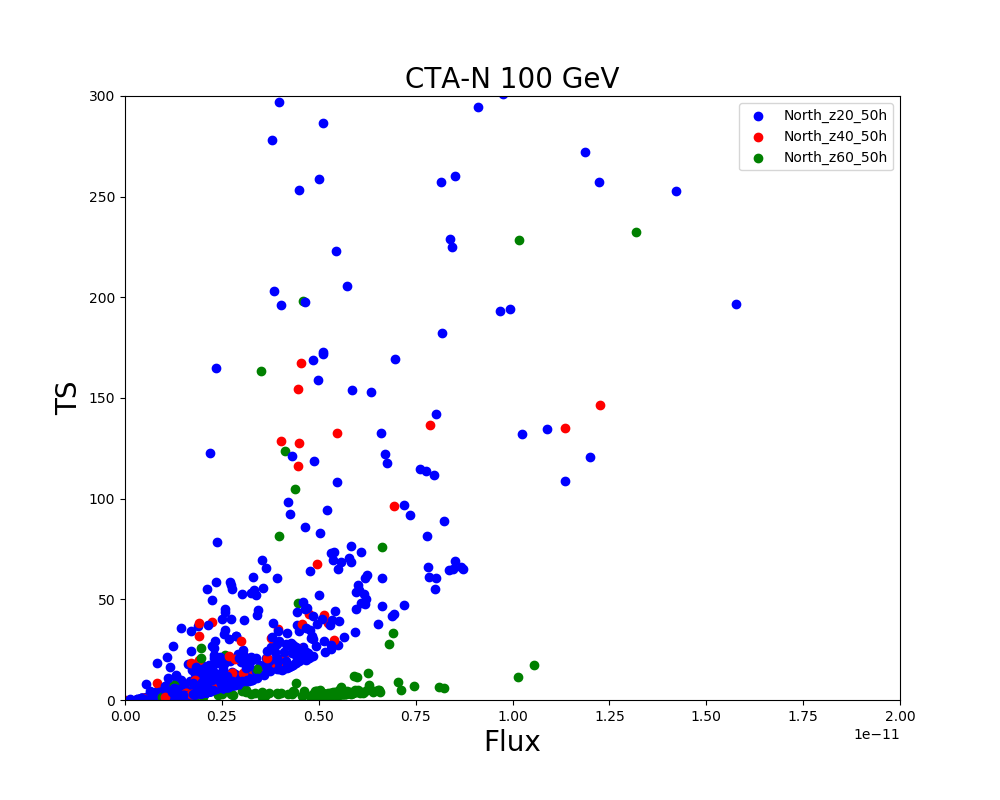
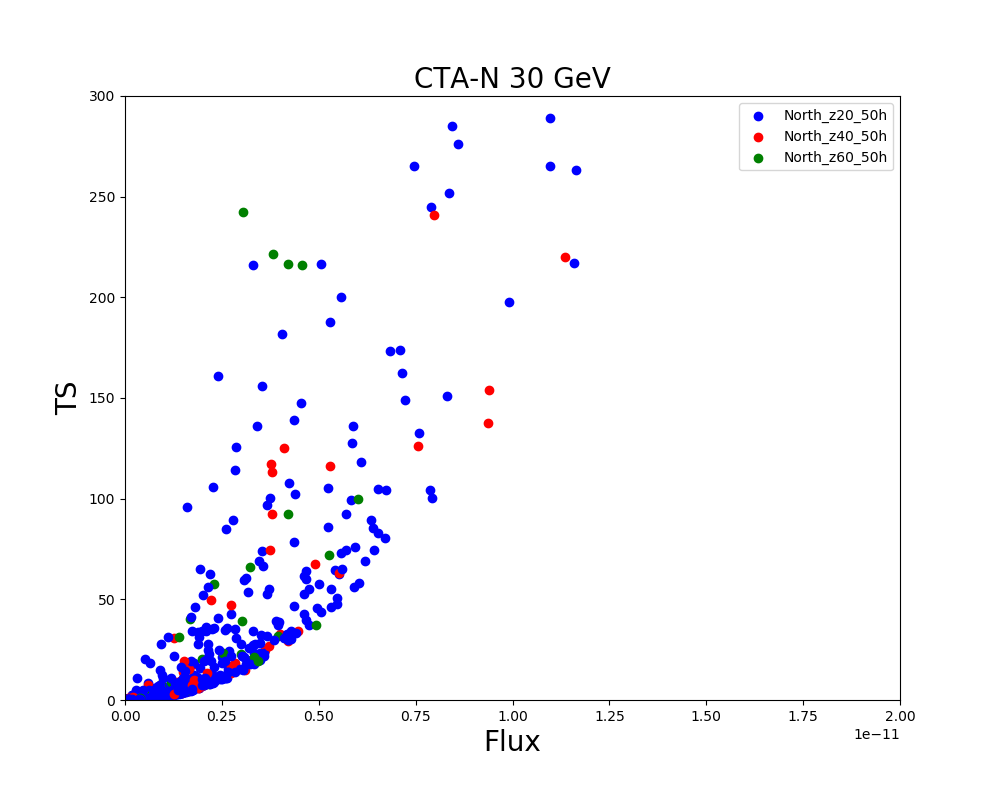
Thanks to superb help from Luigi, we have managed to pin point the source of this cluster for 100 GeV threshold simulations as being a bunch of faint sources which all use the IRF 'North_z60_50hr’. When plotting the TS vs flux ('flux_ts_irf_100gev.png’) it is seen that we have this cluster as a second branch on the plot
This is not seen for any other thresholds ('flux_ts_irf_30gev.png’ for example)
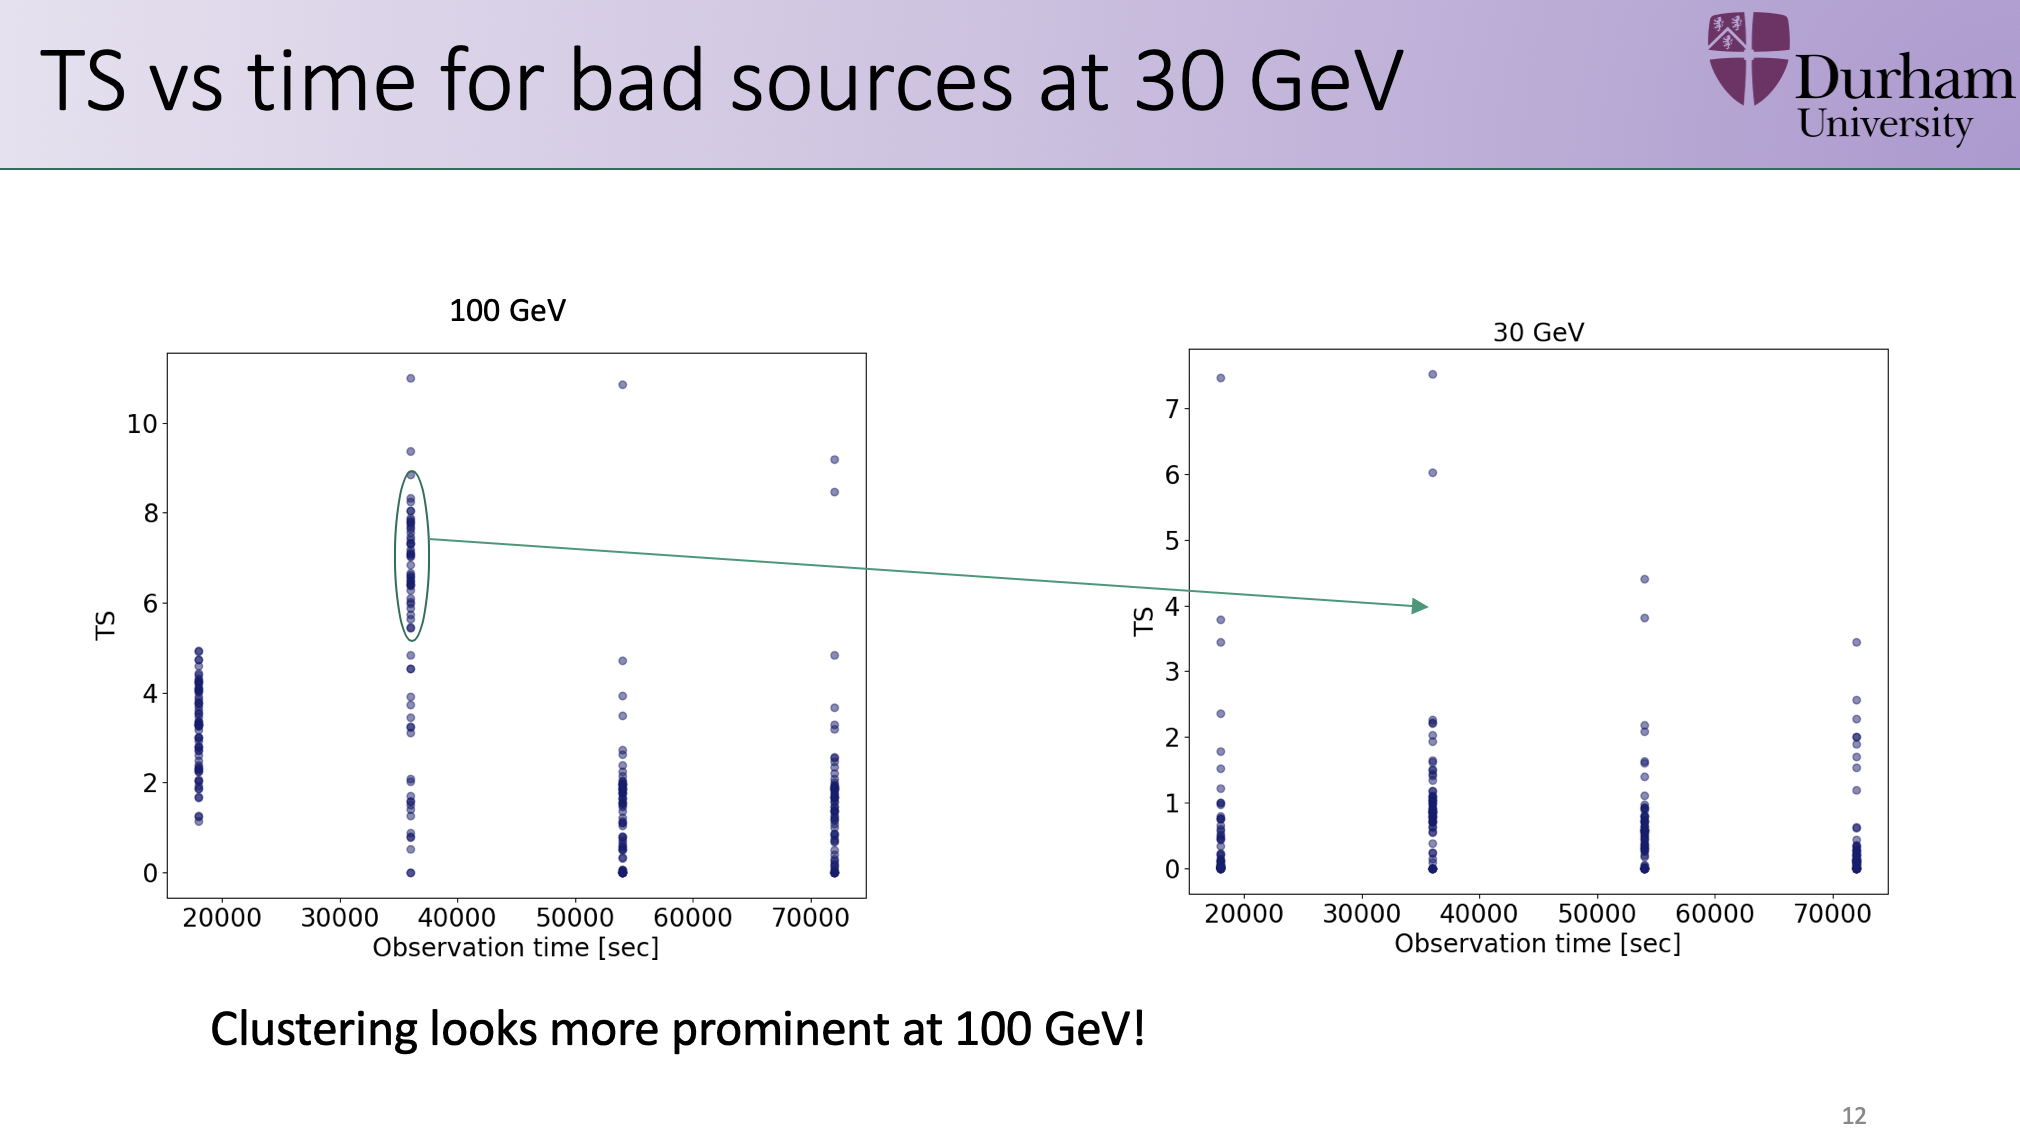
We have looked into the TS vs observation time and looks like for these strange sources there is also a strange clustering in this plot especially for 10 hour observations ('TS_vs_time_weird.png’)
While it is not really such a huge problem: it mainly affects sources that won’t be detected in any case... it puts some doubts/worries on the rest of the numbers and is being followed up on
#8
 Updated by Knödlseder Jürgen over 4 years ago
There is one thing that you may check, in case you are able to recompile GammaLib from source. There is a flag in one of the classes that enables a caching of the instrument response function to speed things up, and I was wondering whether this may cause any problems. You can switch the caching off by changing two flags in the inst/spi/src/GCTAResponse.cpp file. Below what you should do, then recompile the code.
void GCTAResponse::init_members(void)
{
    // Initialize members
    //m_use_irf_cache  = true;   //!< Switched on by default
    //m_use_nroi_cache = true;   //!< Switched on by default
    m_use_irf_cache  = false;   //!< Switch them OFF for testing
    m_use_nroi_cache = false;   //!< Switch them OFF for testing
    m_irf_cache.clear();
    m_nroi_cache.clear();

    // Return
    return;
}
#9
 Updated by Acharyya Atreya over 4 years ago
- File image.png added
#10
 Updated by Acharyya Atreya over 4 years ago
Acharyya Atreya wrote:
Thanks for the help Jurgen and Luigi. I can now confirm that this problem seems to have been improved for now


