Action #2938

Add support for Castro plots in csspec
| Status: | Closed | Start date: | 07/08/2019 | |
|---|---|---|---|---|
| Priority: | Normal | Due date: | ||
| Assigned To: |  Cardenzana Josh Cardenzana Josh | % Done: | 100% | |
| Category: | - | |||
| Target version: | 1.7.0 | |||
| Duration: |
Description
csspec should optionally return the likelihood profile for each energy bin.
sed_10ebins_NODES.png - sed for strong source, method=NODES (62 KB)
sed_10ebins_SLICE.png - sed for strong source, method=SLICE (61.2 KB)
sed_10ebins_weak_NODES.png - sed for weak source, method=NODES (77.6 KB)
sed_10ebins_weak_SLICE.png - sed for weak source, method=SLICE (75 KB)
sed_30ebins_strng_NODES.png - sed for strong source, method=NODES (43.5 KB)
sed_30ebins_strng_SLICE.png - sed for strong source, method=SLICE (42.6 KB)
sed_30ebins_weak_NODES.png - sed for weak source, method=NODES (40.4 KB)
sed_30ebins_weak_SLICE.png - sed for weak source, method=SLICE (51.9 KB)
sed_30ebins_weak_NODES_zoomed.png - sed for weak source, method=NODES, zoomed on region of interest (115 KB)
sed_30ebins_strng_NODES_2hrs.png (86.9 KB)
sed_30ebins_strng_SLICE_2hrs.png (87.5 KB)
sed_30ebins_weak_NODES_2hrs.png (116 KB)
sed_30ebins_weak_SLICE_2hrs.png (118 KB)


Recurrence
No recurrence.
History
#1
 Updated by Cardenzana Josh over 5 years ago
- File sed_10ebins_NODES.png added
- File sed_10ebins_SLICE.png added
- File sed_10ebins_weak_NODES.png added
- File sed_10ebins_weak_SLICE.png added
- Status changed from New to In Progress
- Assigned To set to Cardenzana Josh
- % Done changed from 0 to 80
- dll_sigstep: Determines the step size in standard deviations for generating the profile
- dll_sigmax: Determines the maximum number of standard deviations away from the best fit flux value to profile the likelihood
- e2dnde_scan: Values at which the likelihood profile was evaluated at
- loglike: Reference log-likelihood for the associated loglike profile in this energy bin
- dloglike_scan: delta log-likelihood profiles relative to the associated value in loglike and evaluated at fluxes in e2dnde_scan
- If the normalization has a non-zero error and that error is smaller than the normalization itself, then logarithmically spaced bins are generated covering the range of fluxes specified by [-dll_sigmax,dll_sigmax]
- Otherwise, the range covers [10 -24 ,10 -14 ] or [log10(norm), 10 -14], whichever is larger. The reason for covering such a large range is to ensure there is sufficient coverage to interpolate the loglike value when plotting the profile. This range was also chosen to encompass the flux range covered by a 0.01x → 10x Crab strength source in the range 0.1-100 TeV. There’s no restriction in format guide on the number of bins in a profile, or even that all profiles in an SED need to have the same number of bins, so we can change this if needed.
| method=SLICE | method=NODES | |
|---|---|---|
| Strong Source |  |
 |
| Weak Source |  |
 |
There is an open question regarding when 'method=NODES’ is used. In this case the reference loglike value is the log-likelihood for the entire energy range, rather than just the energy range of the given bin. The profiles are still valid, but the value represented in the 'loglike’ column is defined differently than when 'method=SLICE’ is used.
I've also updated the names of the SED columns to reflect the values specified in the gamma-ray formats documentation for SEDs:https://gamma-astro-data-formats.readthedocs.io/en/latest/spectra/flux_points/index.html#flux-points
This means that the following column names have been changed (Note that this may result in breaking external scripts used to extract this information):
- Energy → e_ref
- ed_Energy → e_min
- eu_Energy → e_max
- Flux → e2dnde
- e_Flux → e2dnde_err
- TS → ts (lowercase)
- Npred → npred
- UpperLimit → e2dnde_ul
- SED_TYPE ('likelihood’ if likelihood profile is generated, otherwise 'e2dnde’)
- UL_CONF (Confidence level of the upper limits, extracted from the default value of ctulimit since csspec does not support setting this value)
- Decide whether we want to leave the difference in definition of
loglikecolumn for the two methods - Decide if we want to keep the breaking change of renaming the columns
- User: jcardenzana
- Repo: ctools
- Branch: 2938_loglike_profile
#2
Updated by Cardenzana Josh about 5 years ago
- % Done changed from 80 to 90
I’ve implemented the code as per the gamma-astro data format. This required some re-structuring of the header keywords in order to make them as consistent as possible between the version that includes the likelihood profiles and the version that does not. The headers are now as follows:
Standard columns:e_ref→ Reference energy (TeV)e_min→ Energy bin lower bound (TeV)e_max→ Energy bin upper bound (TeV)ref_dnde→ Differential Flux at `e_ref` (counts/MeV/cm2/s)ref_e2dnde→ Differential flux at `e_ref` (erg/cm2/s)ref_npred→ Predicted number of events (counts)norm→ Normalization factor for bin (unit-less)norm_err→ Relative error for bin (unit-less)norm_ul→ Relative upper limit for bin (unit-less)ts→ Test statistic for best fit spectrum
norm_scan→ normalized flux values for the flux profiled likelihood (similar tonormcolumn)loglike→ Log likelihood at reference fluxdloglike→ Log likelihood profile at associatednorm_scan
- 'SED_TYPE’ = 'norm,dnde,e2dnde,npred’ identifies that the norm representation (not likelihood) is being used and that ref_dnde, ref_e2dnde, and ref_npred are present in the file.
- 'SED_TYPE’ = 'likelihood,dnde,e2dnde,npred’ identifies that the file contains all the same columns as the 'norm’ version, but with additional columns containing the likelihood profiles.
The test scripts and fits file have been updated to reflect the changes in the keywords and column names.
#3
Updated by Cardenzana Josh about 5 years ago
- File sed_30ebins_strng_NODES.png added
- File sed_30ebins_strng_SLICE.png added
- File sed_30ebins_weak_NODES.png added
- File sed_30ebins_weak_SLICE.png added
- File sed_30ebins_weak_NODES_zoomed.png added
- Status changed from In Progress to Feedback
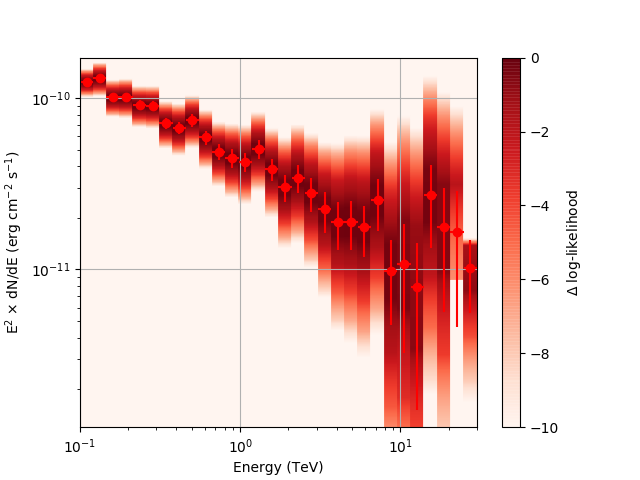
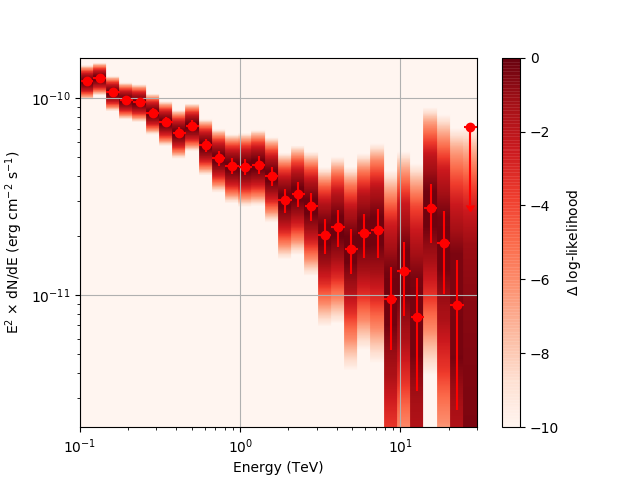
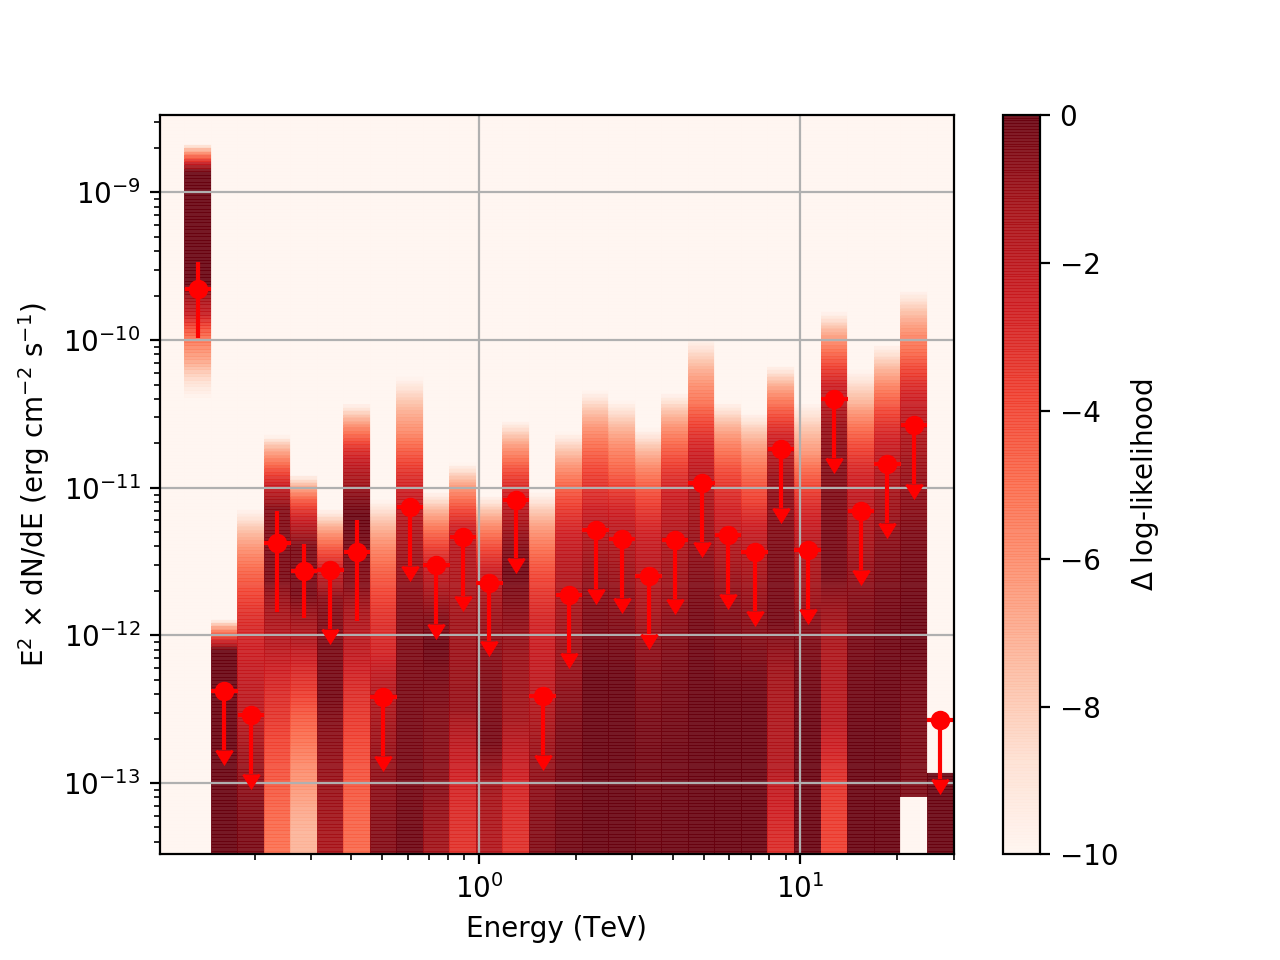
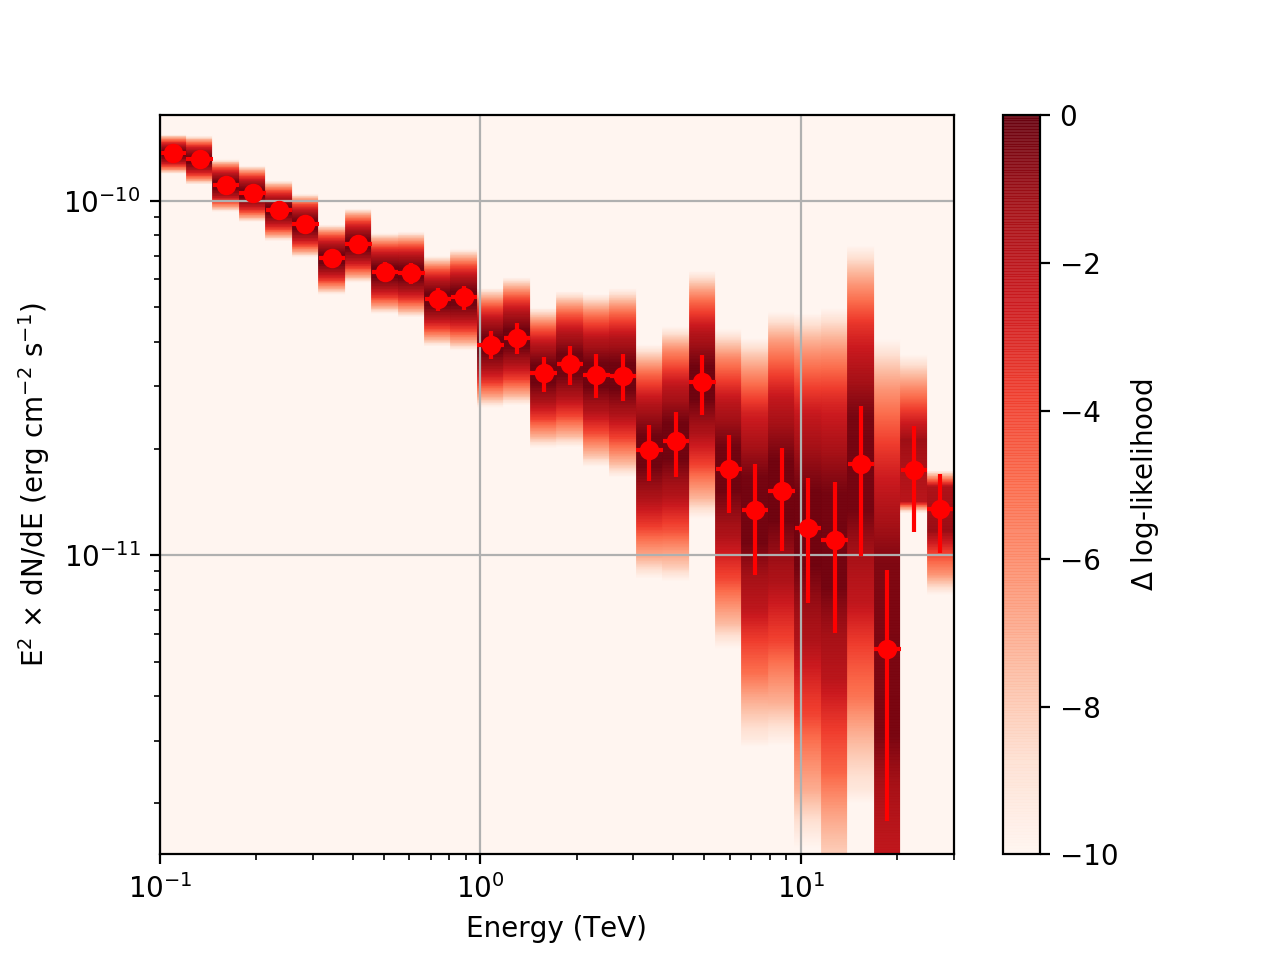
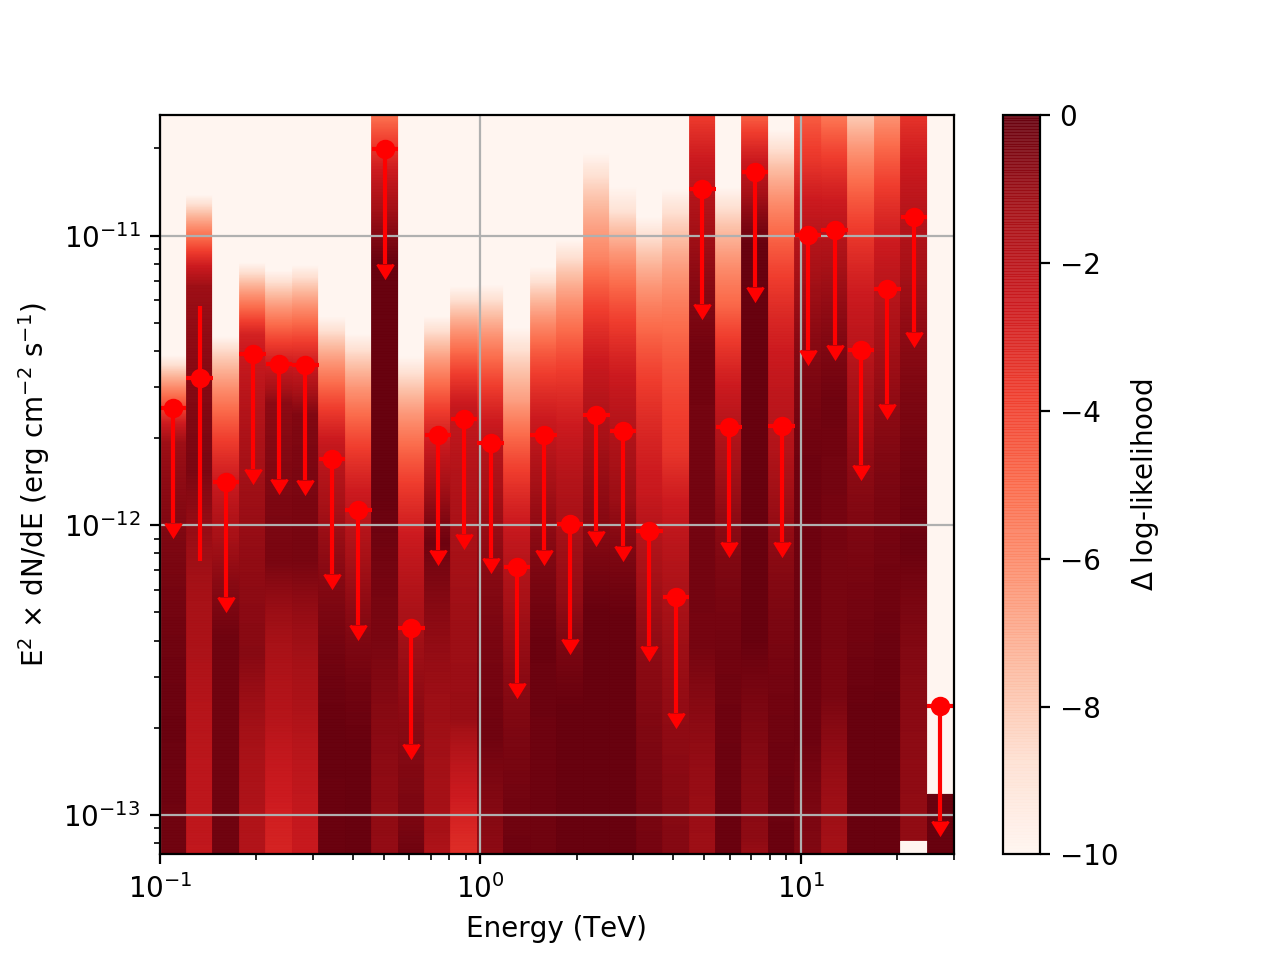
After testing the code, I now have the following SED plots generated by csspec and plotted with show_spectrum.py. Short story is that the 'SLICES’ method appears to generate profiles that look just fine, but the NODES function has some issues when there is very little data in a bin:
| method=SLICE | method=NODES | |
|---|---|---|
| Strong Source |  |
 |
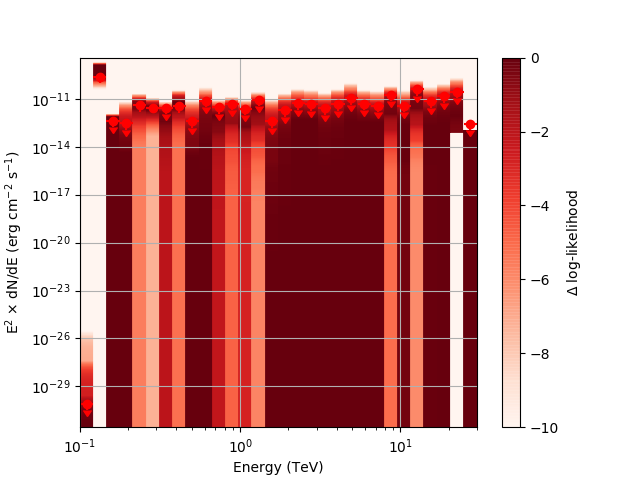
| Weak Source |  |
 |
Basically, what appears to be happening is that the likelihood profile changes very rapidly (e.g. it drops several orders of magnitude between two interpolated flux bins) in these bins and the resulting interpolated profile appears as though it just cuts off.
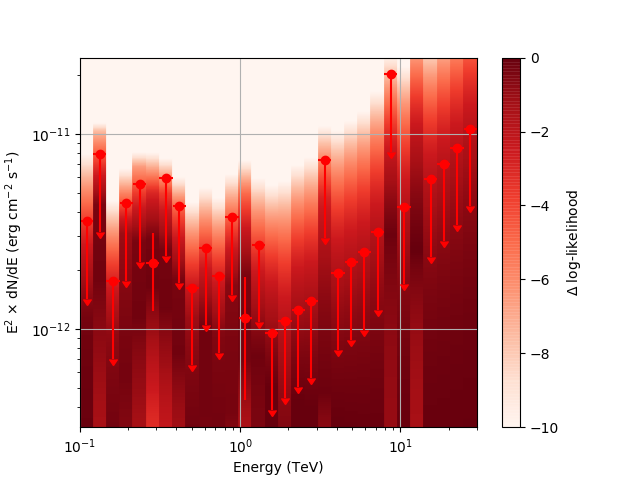
Regarding the weak nodes image, if we zoom in to the region where the dominant number of flux points lie we get the following:
Looking more closely at the second bin shows that there are actually points where the delta-loglike goes positive, which I don’t think should happen if we’ve found the best fit value in the initial fit. I’m a little unsure how to proceed from here, so any feedback would be appreciated.
Development location:- User: jcardenzana
- Repo: ctools
- Branch: 2938_loglike_profile
#4
Updated by Cardenzana Josh about 5 years ago
- File sed_30ebins_strng_NODES_2hrs.png added
- File sed_30ebins_strng_SLICE_2hrs.png added
- File sed_30ebins_weak_NODES_2hrs.png added
- File sed_30ebins_weak_SLICE_2hrs.png added
- Status changed from Feedback to Pull request
- % Done changed from 90 to 100
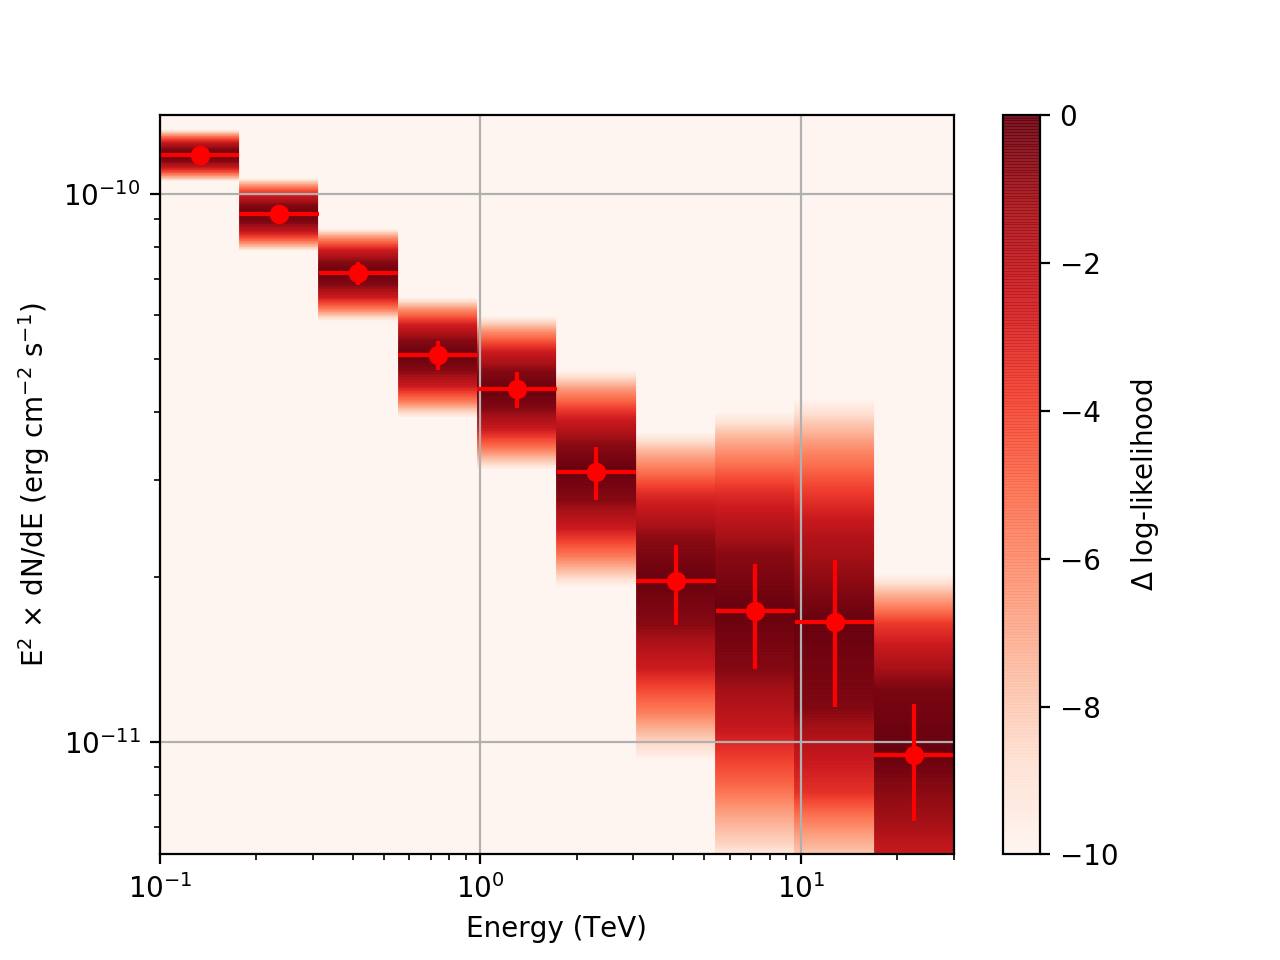
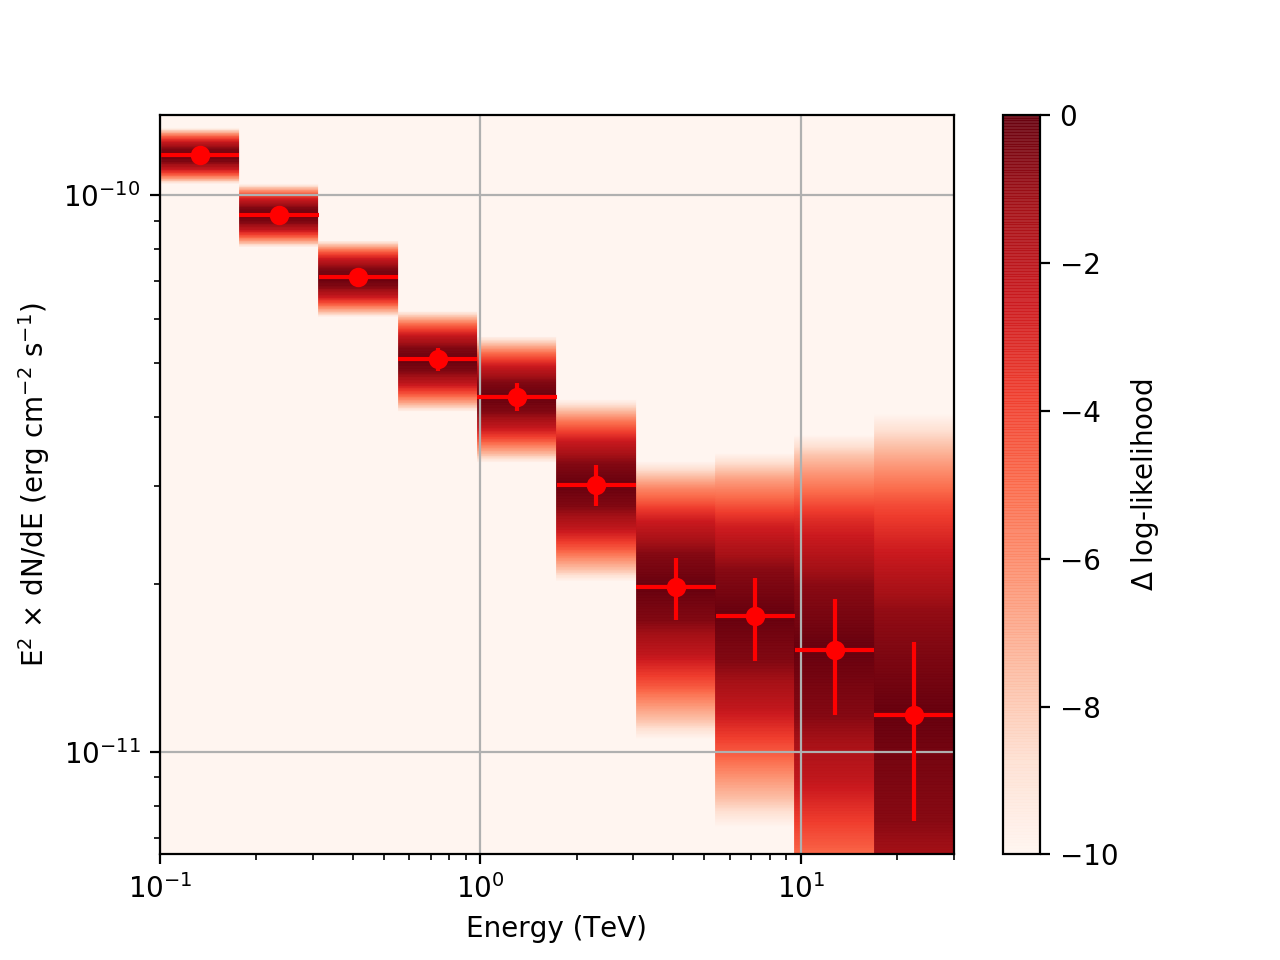
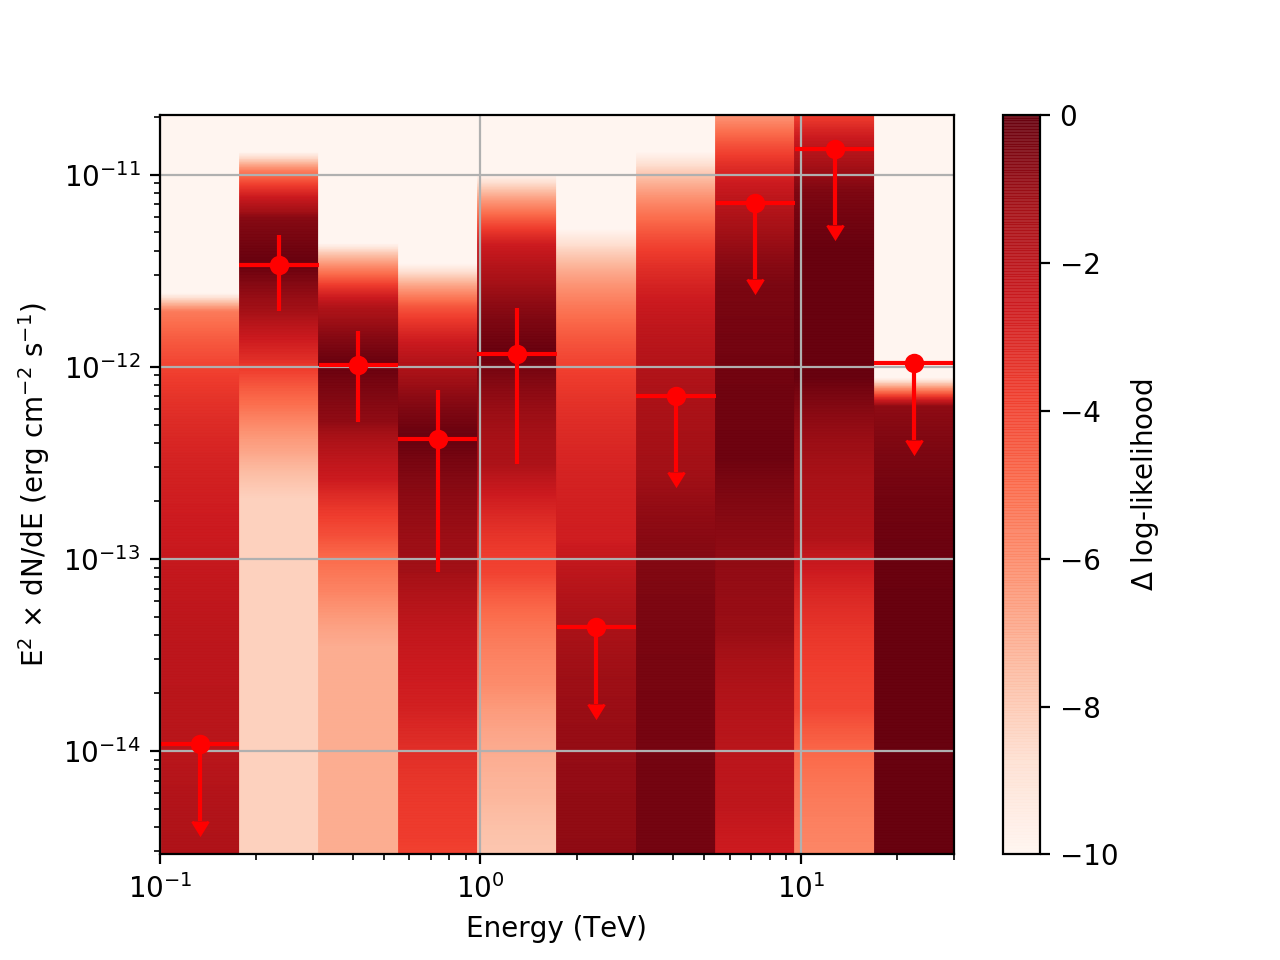
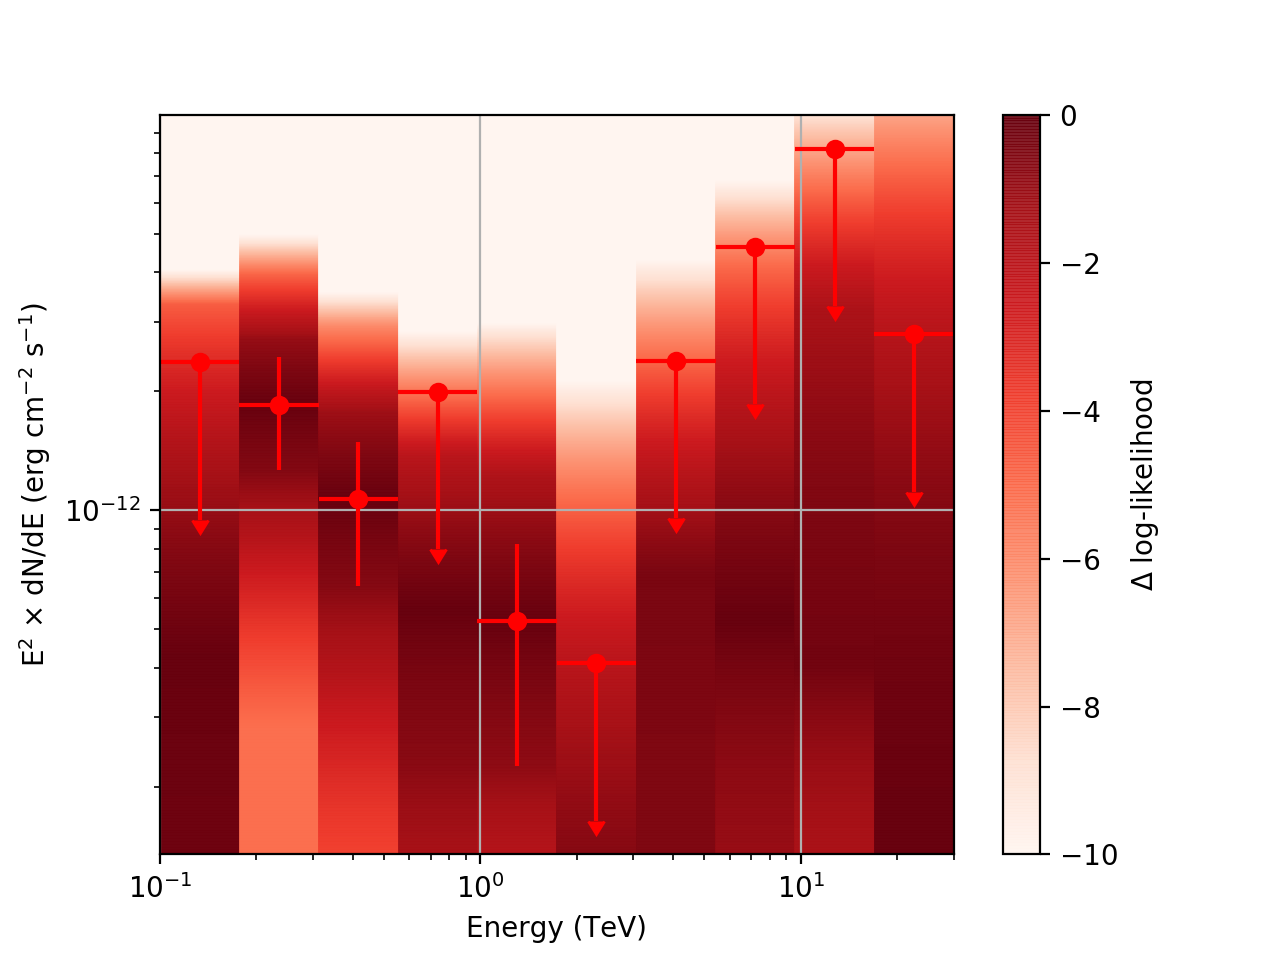
After a little more investigation, I believe the issue that I was seeing had to do with the amount of data that I was simulating. I increased to simulating 2 hours and the results that come out look much better (i.e. the profiles appear to line up with the spectral points which all appear within a reasonable differential flux range):
| method=SLICE | method=NODES | |
|---|---|---|
| Strong Source | 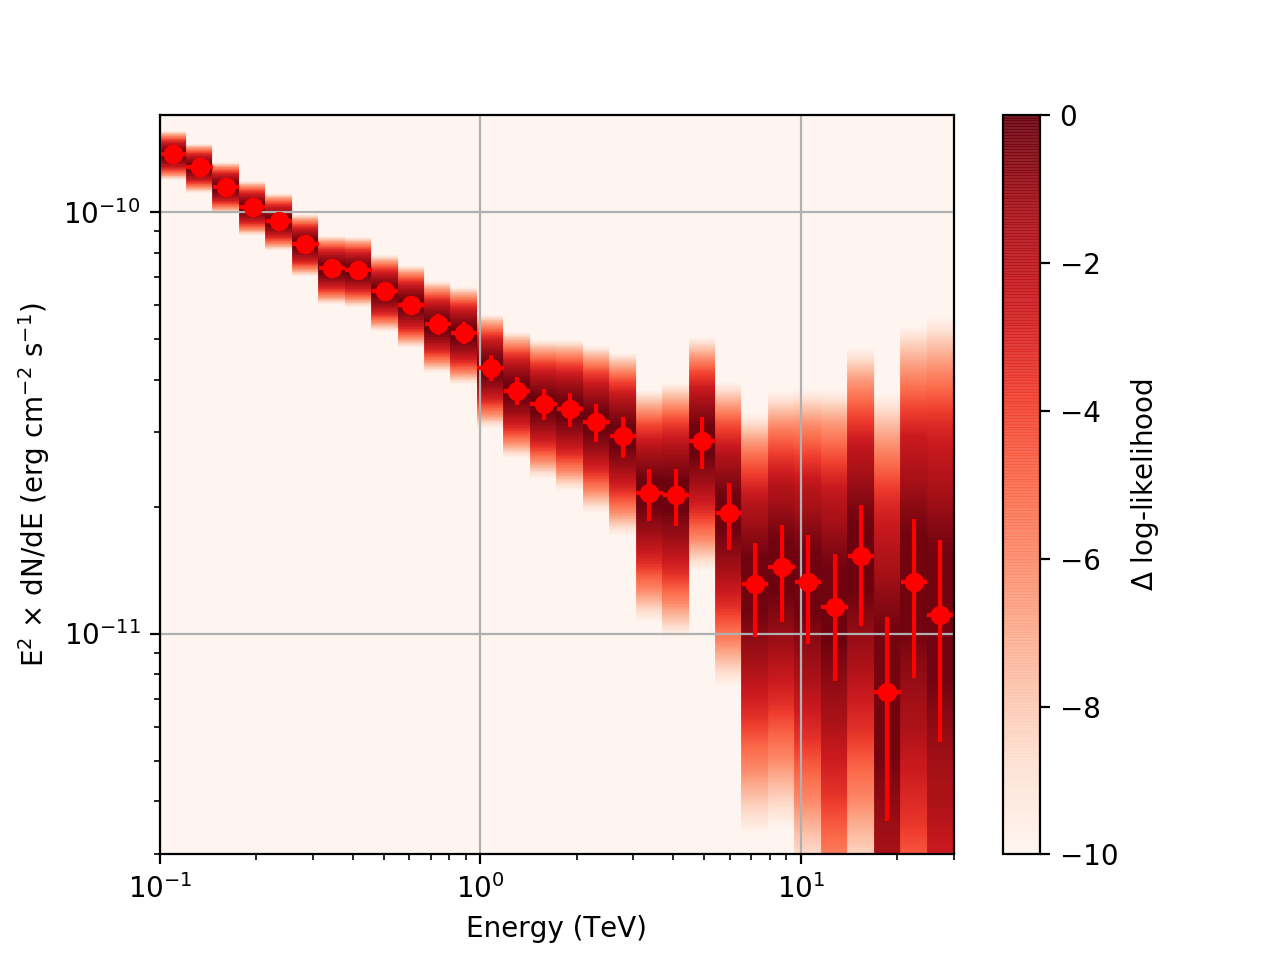 |
 |
| Weak Source | 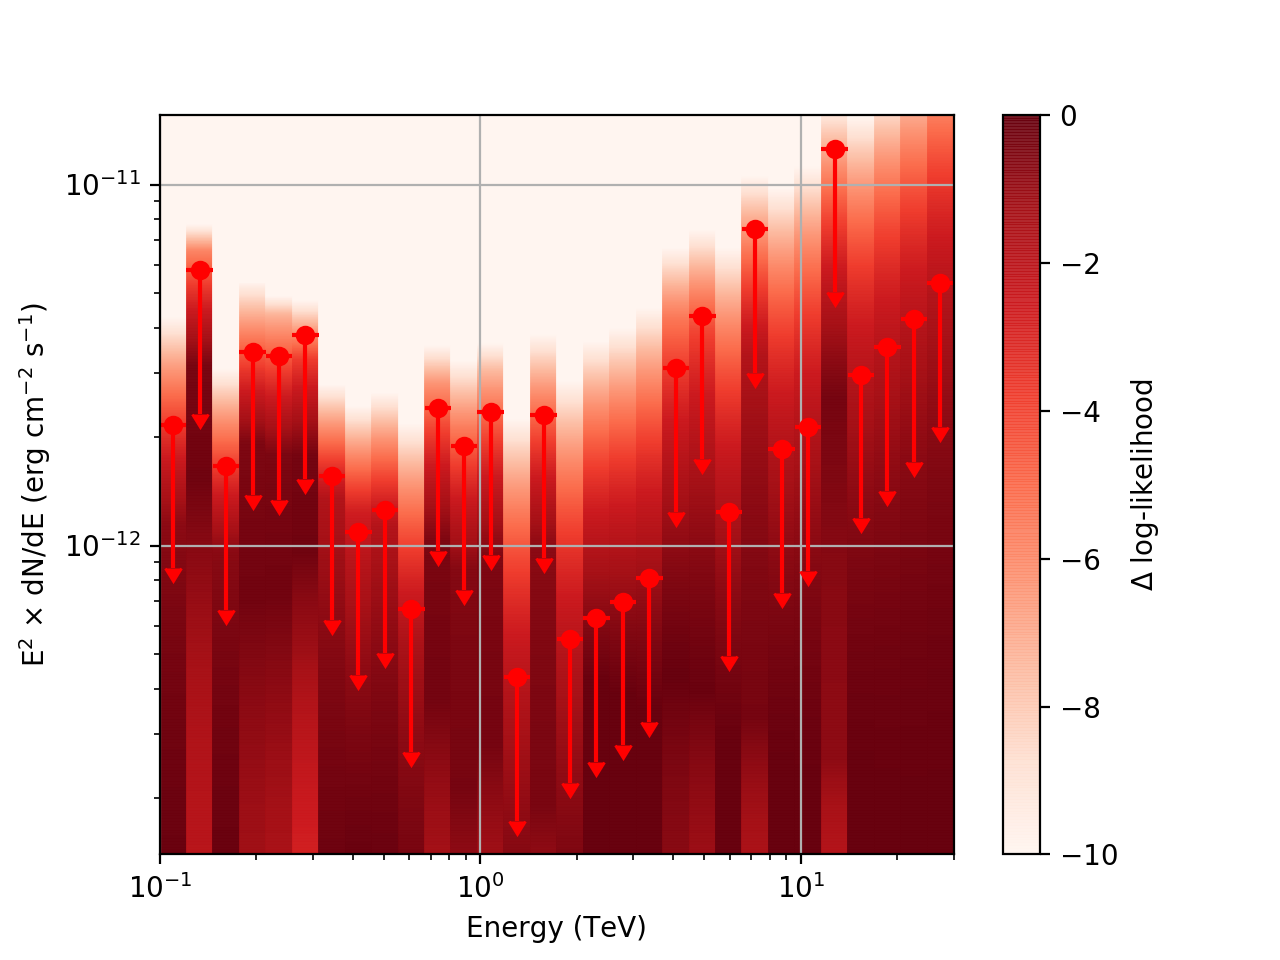 |
 |
I’ve also added a brief tutorial demonstrating how to run csspec to generate the likelihood profiles and modified the documentation to reflect this.
Pull information:- User: jcardenzana
- Repo: ctools
- Branch: 2938_loglike_profile
#5
 Updated by Knödlseder Jürgen about 5 years ago
- Status changed from Pull request to Closed
Merged into devel.