Bug #3156

show_pull_histogram.py broken with matplotlib > 3.1.0
| Status: | Closed | Start date: | 02/05/2020 | |
|---|---|---|---|---|
| Priority: | Normal | Due date: | ||
| Assigned To: |  Cardenzana Josh Cardenzana Josh | % Done: | 100% | |
| Category: | - | |||
| Target version: | 1.7.0 | |||
| Duration: |
Description
This issue only affects source builds. I noticed an issue with show_pull_histogram.py failing the tests. The issue appears to be that the script uses the `matplotlib.mlab.normpdf` function which was removed in matplotlib v3.1.0 (see here). Running the script with matplotlib v3.1.3 confirms this method does not exist and throws:
AttributeError: module 'matplotlib.mlab' has no attribute 'normpdf'
I believe issue #3136 is related.
cspull_test.png (69 KB)

Recurrence
No recurrence.
Related issues
History
#1
 Updated by Cardenzana Josh almost 5 years ago
- Related to Bug #3136: make check fails with test_examples.py added
#2
Updated by Cardenzana Josh almost 5 years ago
- File cspull_test.png added
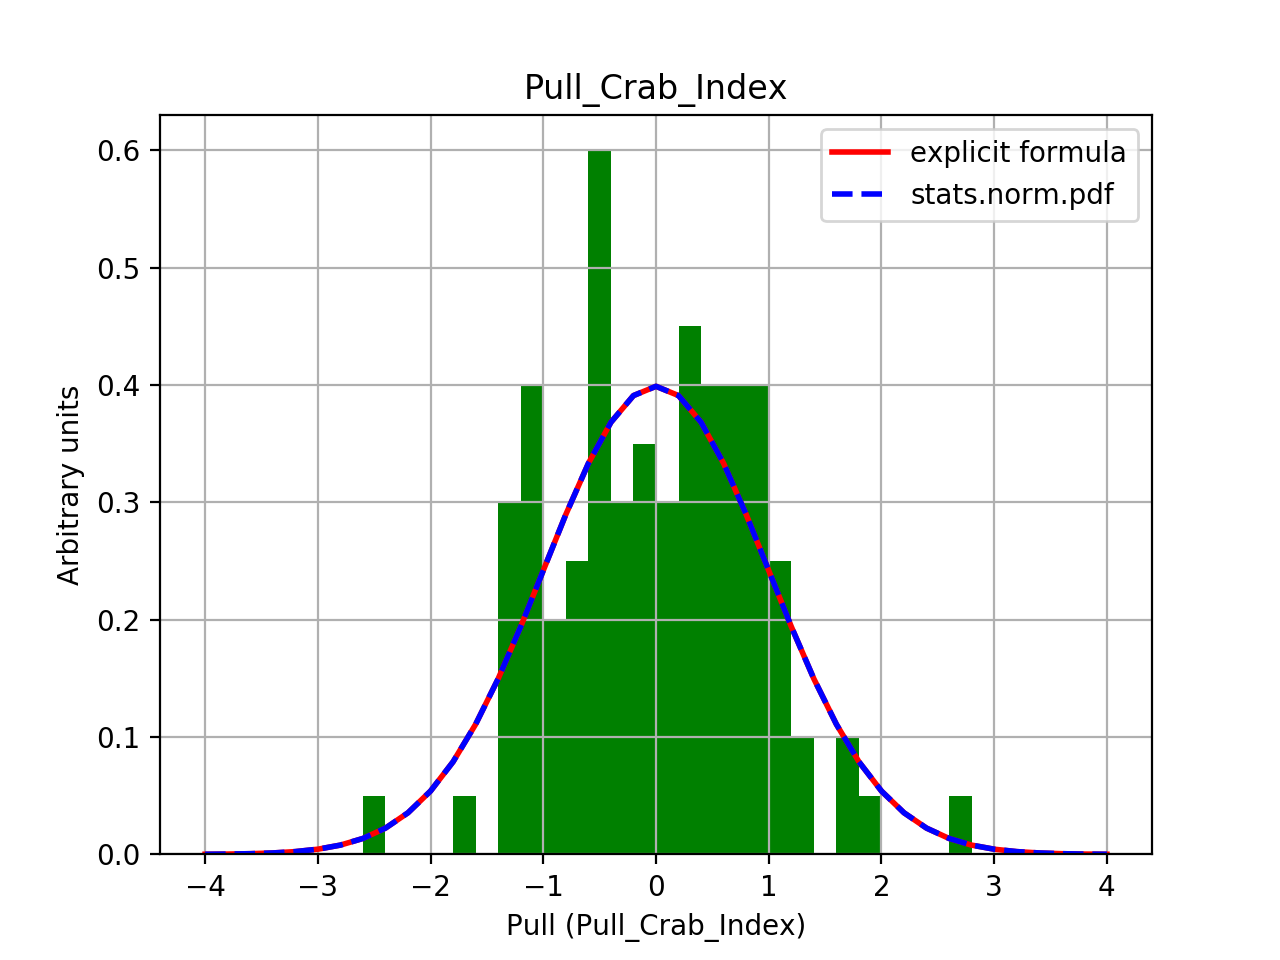
The documentation suggests using scipy.stats.norm.pdf instead, but that would introduce another dependency.
Instead I propose the simple replacement by the following (which just does the calculation explicitly):
y = np.exp(-0.5*bins*bins) / np.sqrt(2.0*np.pi)
NumPy is already a dependency in the script, but it removes the need for matplotlib.mlab. The results are exactly the same using the suggested workaround and the explicit formula:
#3
Updated by Cardenzana Josh almost 5 years ago
- % Done changed from 0 to 100
I’ve implemented the above changes here:
Pull information:- Username: jcardenzana
- repository: ctools
- branch: 3156_remove_normpdf
#4
 Updated by Knödlseder Jürgen almost 5 years ago
- Status changed from New to Pull request
#5
Updated by Knödlseder Jürgen almost 5 years ago
- Status changed from Pull request to Closed
Merged into devel.