Action #3929

Follow up Masha's problems with the light curve of PWN2059
| Status: | Closed | Start date: | 12/10/2021 | |
|---|---|---|---|---|
| Priority: | Normal | Due date: | ||
| Assigned To: |  Knödlseder Jürgen Knödlseder Jürgen | % Done: | 100% | |
| Category: | - | |||
| Target version: | 2.0.0 | |||
| Duration: |
Description
This action refers to an e-mail exchange with Masha concerning PWN2059 in the GPS simulation data.
pwn2059_192_201_smoothed.png (353 KB)
pwn2059_reference.png (44.5 KB)
pwn2059_10000sims.png (43.9 KB)
sim192.png (44.2 KB)
sed_mc_model.png (33.5 KB)
sed_cat_model.png (32.4 KB)
sim192_above2.44TeV.png (42.8 KB)
sim201_above2.44TeV.png (41.8 KB)
sim192_above2.44TeV_ctools-2.0.0.dev.png (45.8 KB)
sim201_above2.44TeV_ctools-2.0.0.dev.png (42.7 KB)
skymap-nopwn.png (321 KB)


Recurrence
No recurrence.
History
#1
 Updated by Knödlseder Jürgen about 3 years ago
- Status changed from New to In Progress
- % Done changed from 0 to 10
First I tried to reproduce Masha’s results and I managed to do so:
2021-12-10T16:11:40: +=========================================+
2021-12-10T16:11:40: | Maximum likelihood optimisation results |
2021-12-10T16:11:40: +=========================================+
2021-12-10T16:11:40: === GOptimizerLM ===
2021-12-10T16:11:40:  Optimized function value ..: 348541.336
2021-12-10T16:11:40:  Absolute precision ........: 0.005
2021-12-10T16:11:40:  Acceptable value decrease .: 2
2021-12-10T16:11:40:  Optimization status .......: converged
2021-12-10T16:11:40:  Number of parameters ......: 231
2021-12-10T16:11:40:  Number of free parameters .: 4
2021-12-10T16:11:40:  Number of iterations ......: 1
2021-12-10T16:11:40:  Lambda ....................: 0.0001
2021-12-10T16:11:40:  Total number of iterations : 8
2021-12-10T16:11:40:  Maximum log likelihood ....: -348541.336
2021-12-10T16:11:40:  Observed events  (Nobs) ...: 52107.000
2021-12-10T16:11:40:  Predicted events (Npred) ..: 51863.589 (Nobs - Npred = 243.411000453176)
...
2021-12-10T16:11:40: === GModelSky ===
2021-12-10T16:11:40:  Name ......................: R000085_00001_J1737-3837
2021-12-10T16:11:40:  Instruments ...............: all
2021-12-10T16:11:40:  Test Statistic ............: 34.7896858851891
2021-12-10T16:11:40:  Observation identifiers ...: all
2021-12-10T16:11:40:  Model type ................: PointSource
2021-12-10T16:11:40:  Model components ..........: "PointSource" * "ExponentialCutoffPowerLaw" * "Constant"
2021-12-10T16:11:40:  Number of parameters ......: 7
2021-12-10T16:11:40:  Number of spatial par's ...: 2
2021-12-10T16:11:40:   RA .......................: 264.370455982881 deg (fixed,scale=1)
2021-12-10T16:11:40:   DEC ......................: -38.6193821817504 deg (fixed,scale=1)
2021-12-10T16:11:40:  Number of spectral par's ..: 4
2021-12-10T16:11:40:   Prefactor ................: 9.37556142183426e-19 +/- 2.55043578929073e-19 [0,infty[ ph/cm2/s/MeV (free,scale=1e-18,gradient)
2021-12-10T16:11:40:   Index ....................: -1.93913156282528 [-9,0]  (fixed,scale=-1,gradient)
2021-12-10T16:11:40:   CutoffEnergy .............: 2194778.42864015 [10000,500000000] MeV (fixed,scale=1000000,gradient)
2021-12-10T16:11:40:   PivotEnergy ..............: 1000000 MeV (fixed,scale=1000000,gradient)
2021-12-10T16:11:40:  Number of temporal par's ..: 1
2021-12-10T16:11:40:   Normalization ............: 1 (relative value) (fixed,scale=1,gradient)
2021-12-10T16:11:40:  Number of scale par's .....: 0
#2
Updated by Knödlseder Jürgen about 3 years ago
- % Done changed from 10 to 20
Then I tried fitting the data of the first light curve bin with different combinations of model components. In all cases, the predicted number of counts correspond to the observed one. Even with only a few components, PWN 2059 got a low flux, comparable to Masha’s run.
| Components | Nobs-Npred | PWN 2059 |
| Background only | 4.69e-06 | - |
| Background & IEM | 0.0037 | - |
| Background, IEM & PWN 2059 | 0.0059 | 9.51e-19 ± 2.57e-19 |
| Background, IEM & PWN 2059 (free index) | 0.0034 | 9.30e-19 ± 2.60e-19 |
#3
Updated by Knödlseder Jürgen about 3 years ago
- File pwn2059_192_201_smoothed.png added
- % Done changed from 20 to 30
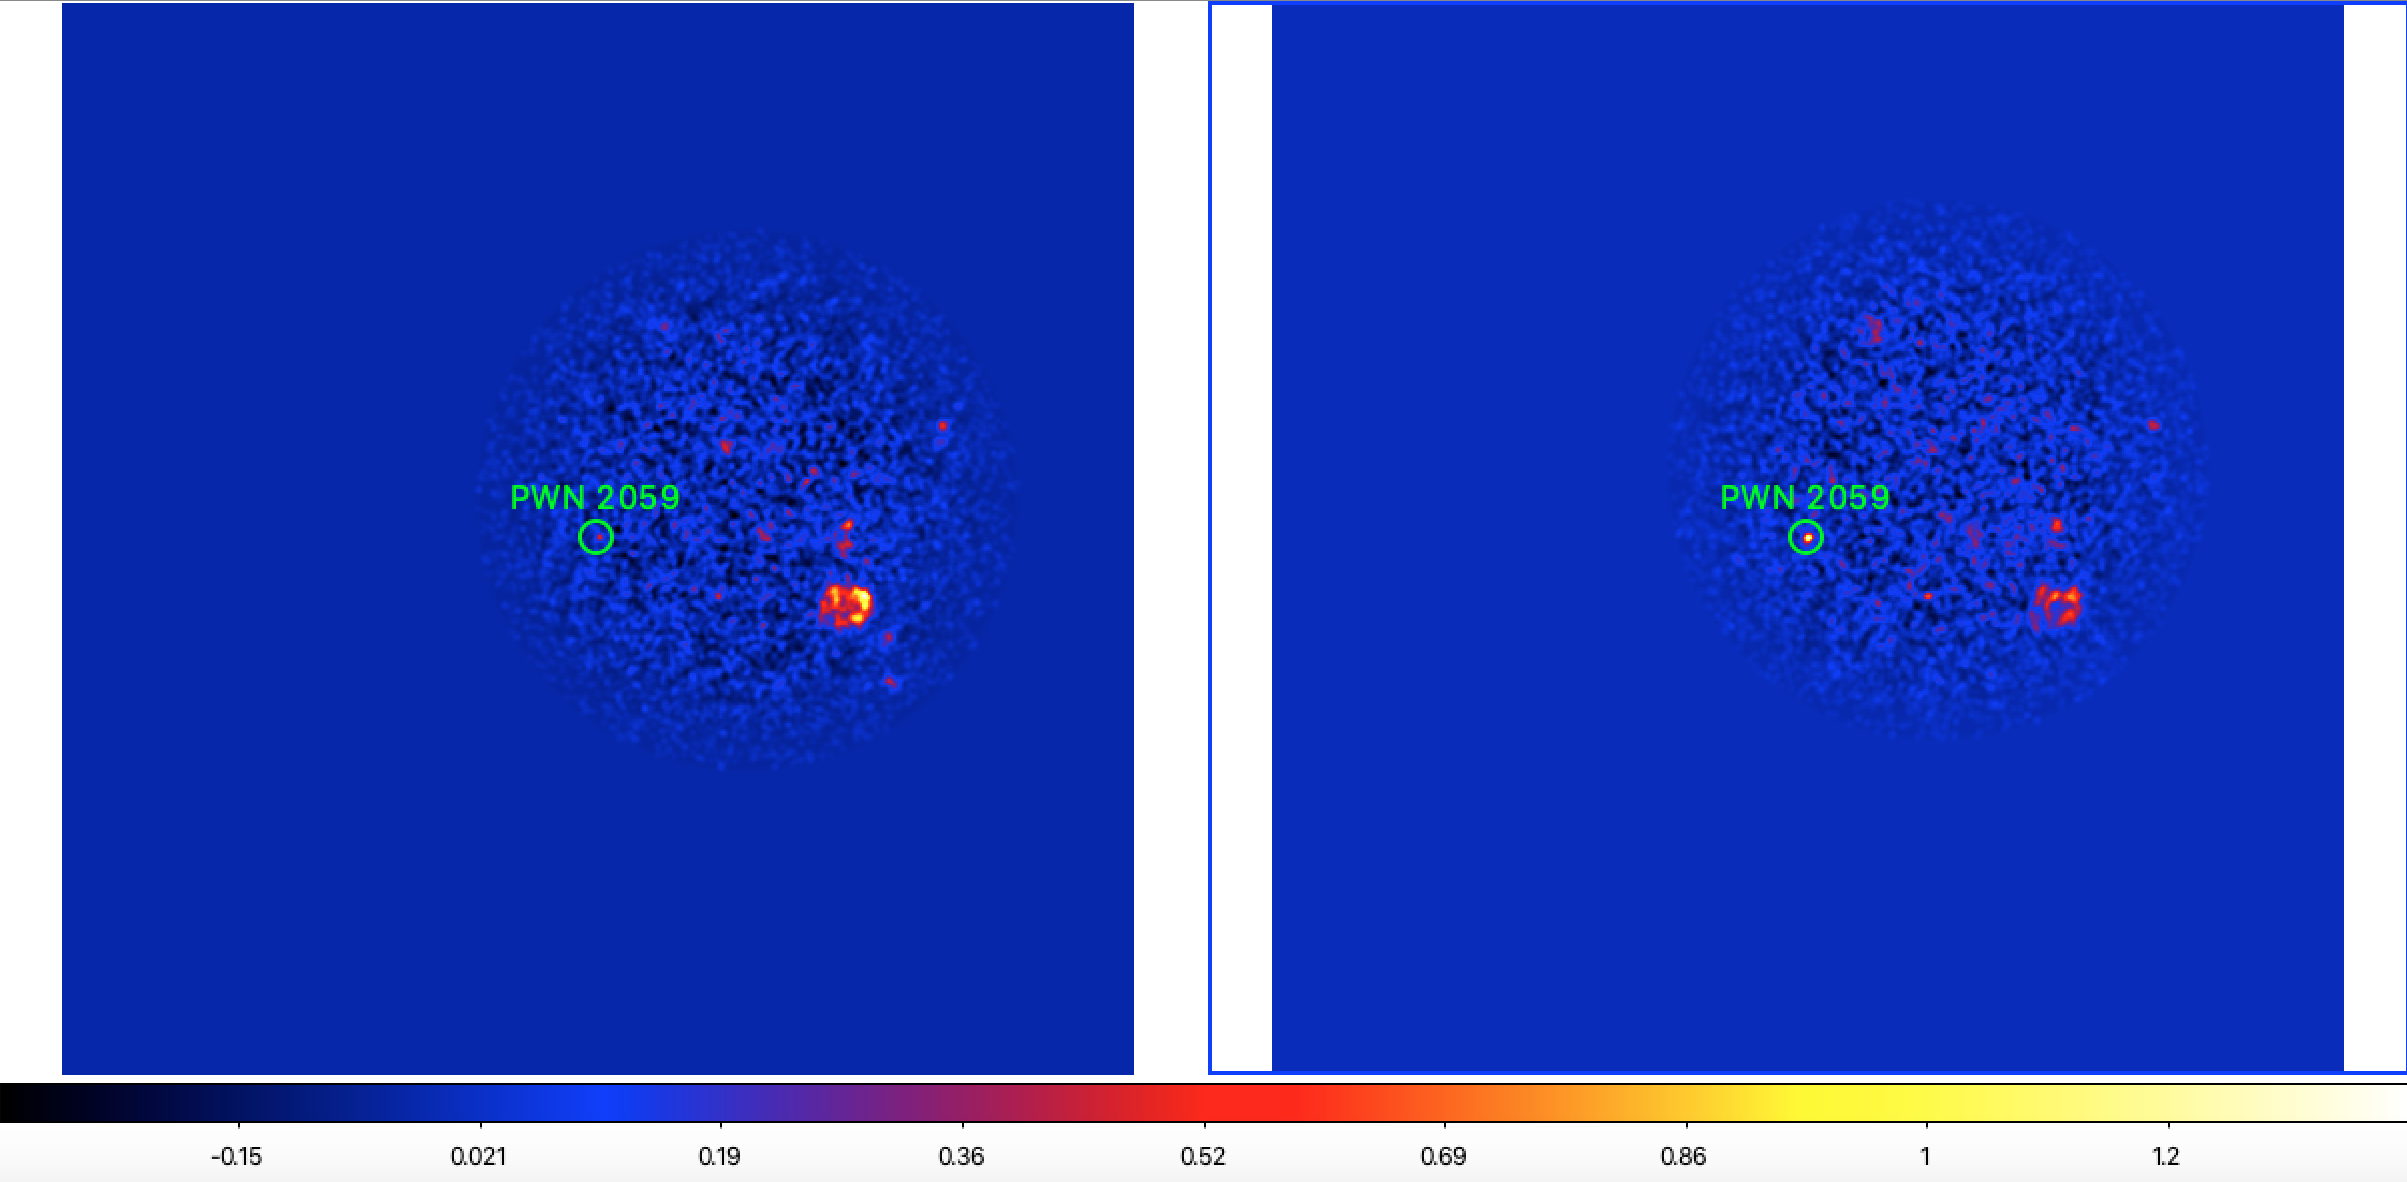
Here are smoothed background subtracted sky maps of the two time bins 192 and 201 (files gps_standard_000192.fits and gps_standard_000201.fits). Obviously PWN 2059 appears much brighter in the second time bin compared to the first time bin.

In the event file, PWN 2059 has the Monte Carlo identifier 1242. In the first time slice there are 50 Monte Carlo events from PWN 2059, while in the second time slice there are 86 events, hence a factor of 1.72 more. A large fraction of the flux discrepancy can therefore be explained by the different number of simulated events.
#4
Updated by Knödlseder Jürgen about 3 years ago
- % Done changed from 30 to 40
Here a summary of the information on the number of simulated photons and events found in the ctobssim log files for the corresponding event files. What is shown is “Number of simulated events / Number of simulated photons”. These numbers are not fully identically to the number of events determined from the event files due to the 0.1-100 TeV energy selection. The original gps_standard_000192.fits file contained 102933 events, the energy selected file contains 52107 events. The original gps_standard_000201.fits file contained 101877 events, the energy selected file contains 51365 events.
In the 3rd to 6th energy slices, the number of simulated events is systematically larger in the 201 time bin compared to the 192 time bin. Maybe this is just “bad luck”?
| Energy range | 192 | 201 |
| 30 - 72.33 GeV | 0/778 | 0/842 |
| 72.33 - 174.37 GeV | 20/751 | 17/681 |
| 174.37 - 420.38 GeV | 17/441 | 34/441 |
| 420.38 GeV - 1.01 TeV | 10/311 | 15/317 |
| 1.01 - 2.44 TeV | 4/158 | 13/187 |
| 2.44 - 5.89 TeV | 1/35 | 8/35 |
| 5.89 - 14.20 TeV | 1/4 | 0/2 |
| 14.20 - 34.24 TeV | 0/0 | 0/0 |
| 34.24 - 82.54 TeV | 0/0 | 0/0 |
| 82.54 - 199 TeV | 0/0 | 0/0 |
| Total | 53/2478 | 87/2505 |
#5
Updated by Knödlseder Jürgen about 3 years ago
I tried to reproduce the simulation on my Mac using the ctools development version with the aim to study simulation procedure. Apparently the use of the random number generator changed, hence the code did not reproduce exactly the same number of events. Switching back to version 1.7.0 that was used for the GPS simulations I managed to reproduce the number of photons and events that were simulated for PWN 2059 in the GPS run 192. I therefore will use ctools version 1.7.0 for the following studies.
| Simulation | Seed | Photons | Events |
| Original GPS dataset (ctools-1.7.0) | 192 | 2478 | 53 |
| Mac OS X (ctools-2.0.0.dev) | 192 | 2500 | 50 |
| Mac OS X (ctools-1.7.0) | 192 | 2478 | 53 |
| Kepler (ctools-1.7.0) | 192 | 2478 | 53 |
#6
Updated by Knödlseder Jürgen about 3 years ago
- File sim192.png added
- File pwn2059_reference.png added
- % Done changed from 40 to 50
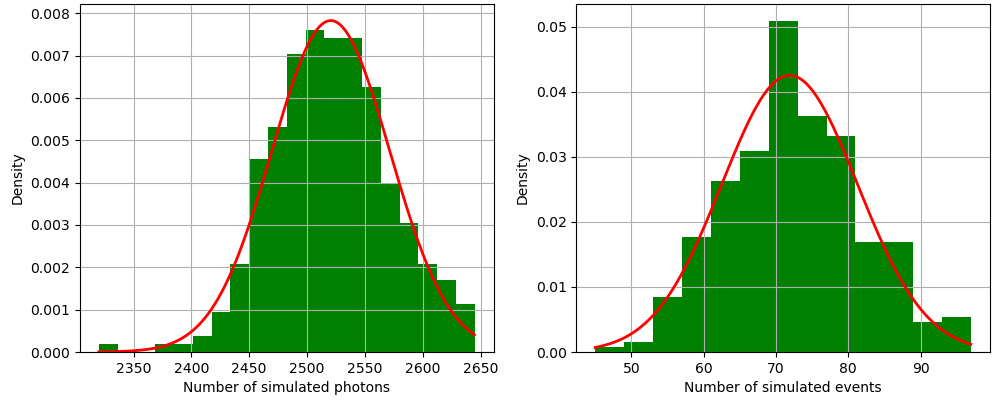
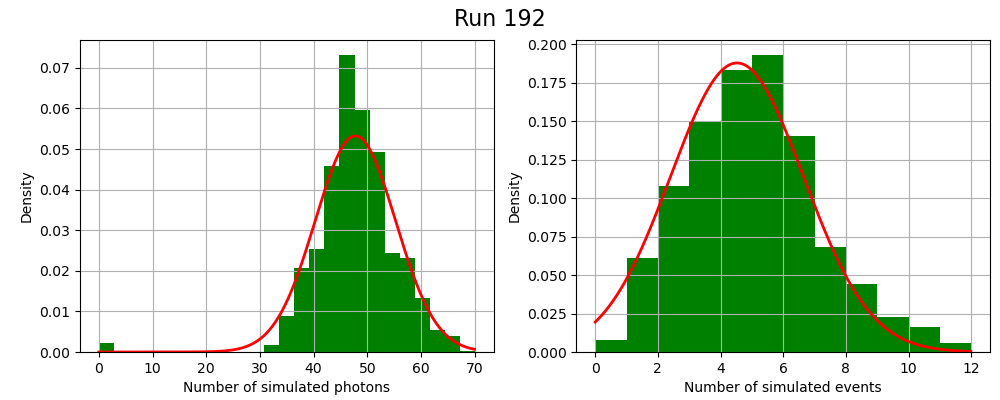
The two leftmost plots are so far only for 324 simulations. I will try to make 1000 simulations to verify the match with the expectation, yet already with 324 simulations there seems to be a reasonable match, and no significant difference to the faster simulations where only PWN 2059 is used.
I investigated whether the observed low number of events is explained by pure statistical fluctuations, or whether there is a possible issue with the random number generator.
To do this I run the simulations using ctools version 1.7.0 by changing the seed parameter of ctobssim which sets the seed value of the random number generator, and extract the number of photons and events that are simulated for PWN 2059. Repeating the process 1000 times for different seed values gives then a distribution of number of photons and events that can be compared to the expectation based on statistical fluctuations only.
The outcome of this process are show below, with the left two panels corresponding to the simulation of the full GPS model, reproducing exactly the simulation that was done for the GPS, while the right two panels correspond to simulations of only PWN 2059, speeding up considerably the simulations. The table below gives the moments of the photon and event distributions. The observed number of 53 events for PWN 2059 in run 192 is a deviation of -18.89 events from the mean, corresponding to -2.01 standard deviations.
| Parameter | Value |
| Mean number of photons | 2520.50 |
| Standard deviation in number of photons | 50.97 |
| Mean number of events | 71.89 |
| Standard deviation in number of events | 9.38 |
 |
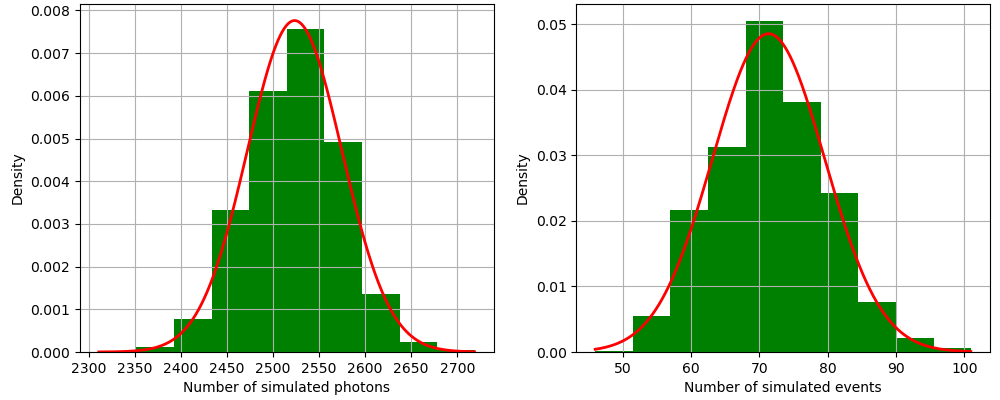 |
Obviously, the resulting histograms correspond to the expectations for statistical fluctuations only, hence the low flux of PWN 2059 in the first time bin can be explained by a statistical fluctuation of about -2 sigma.
As indicated at https://cta.cloud.xwiki.com/xwiki/wiki/phys/view/Galactic%20WG/Galactic%20Plane%20Survey/BinariesAnalysis/ the average prefactor of PWN 2059 is about 2.25-18 ph cm-2 s-1 MeV-1 while the fitted result for run 192 is 9.38e-19 ± 2.55e-19, corresponding to an offset of -5.1 sigma.
So the question is why a statistical fluctuation of about -2 sigma translates into a prefactor offset of -5.1 sigma?
Interestingly, 53 counts is only a factor of 0.74 lower than 72 counts, in other words, the mean prefactor expected for run 192 would be 9.38e-19/0.74 = 1.27e-18 which is almost a factor of 2 below the mean value found by Masha for the other bins.
#7
Updated by Knödlseder Jürgen about 3 years ago
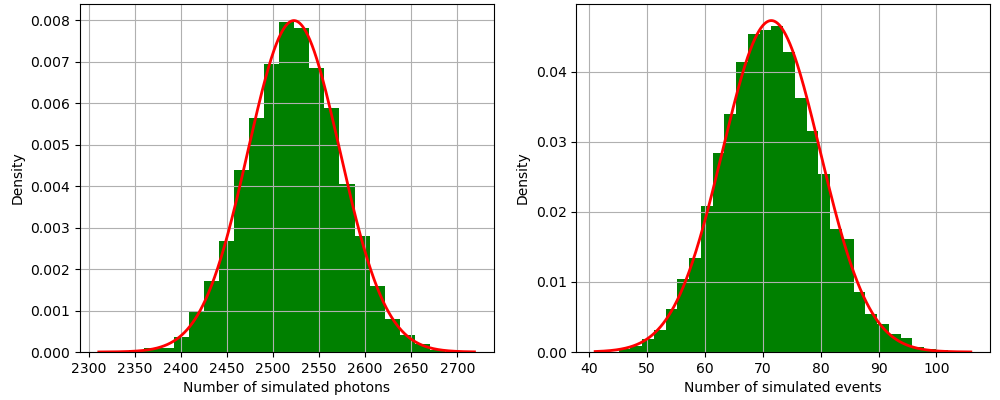
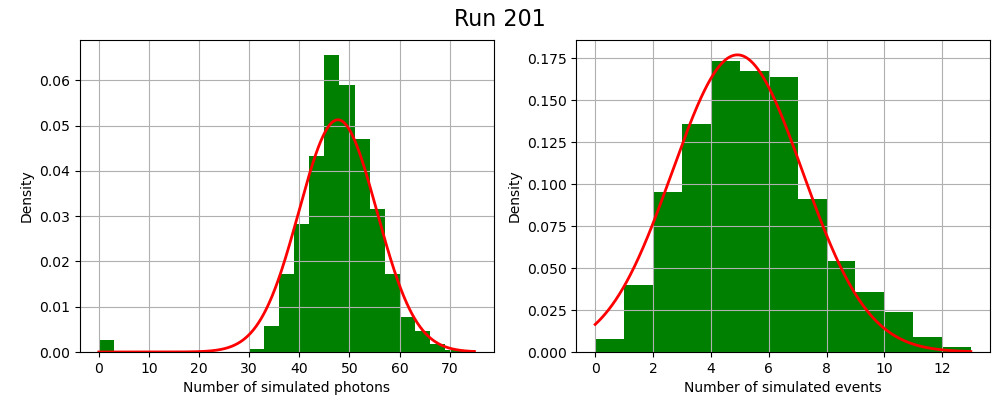
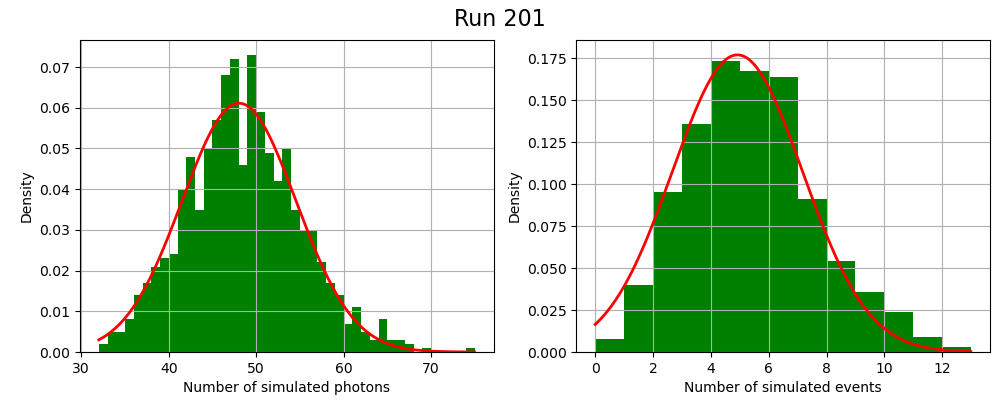
- File pwn2059_10000sims.png added
Below is the result for 10000 simulations of PWN 2059 only. The moments of the distributions are given in the Table below. The observed number of 53 events for PWN 2059 in run 192 is a deviation of -18.44 events from the mean, corresponding to -2.18 standard deviations.
| Parameter | Value |
| Mean number of photons | 2522.72 |
| Standard deviation in number of photons | 49.91 |
| Mean number of events | 71.44 |
| Standard deviation in number of events | 8.44 |
#8
Updated by Knödlseder Jürgen about 3 years ago
- File sim192.png added
#9
Updated by Knödlseder Jürgen about 3 years ago
- File deleted (
sim192.png)
#10
Updated by Knödlseder Jürgen about 3 years ago
- File sim192.png added
#11
Updated by Knödlseder Jürgen about 3 years ago
- File deleted (
sim192.png)
#12
Updated by Knödlseder Jürgen about 3 years ago
- File sed_cat_model.png added
- File sed_mc_model.png added
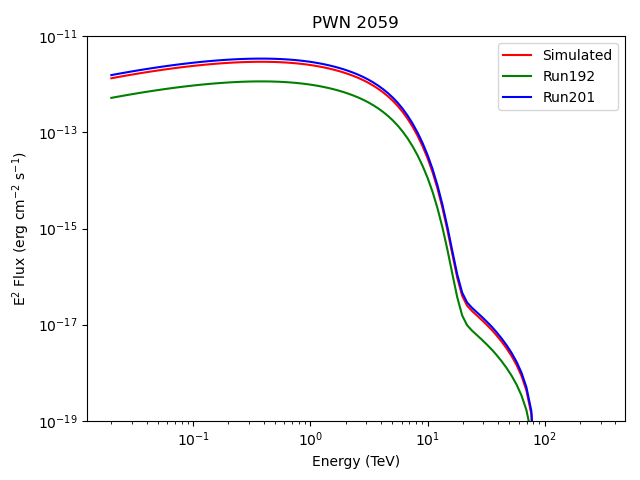
Below the results of fitting various models to the runs 192 and 201. For illustration, the fitted SEDs for the exponential cut-off model (left) and of the MC file function model (right) are shown in the two panels below.
| Model | XML | TS (Run192) | Norm (Run192) | TS (Run201) | Norm (Run201) |
| Catalogue model (exp. cutoff) | mc_model_ready_roiwidth.xml | 34.79 | 0.94 ± 0.26 | 209.76 | 2.75 ± 0.36 |
| MC model (file function) | model_cat_pwn2059.xml | 34.55 | 0.39 ± 0.11 | 209.28 | 1.16 ± 0.15 |
| Idem, free bkg index and IEM | model_cat_pwn2059_free-index-iem.xml | 35.02 | 0.40 ± 0.11 | 209.58 | 1.17 ± 0.15 |
Exponential cut-off 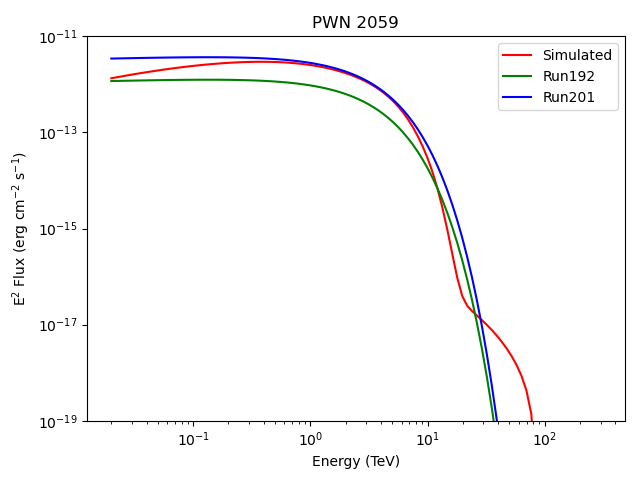 |
File function  |
Note that while the model fit is driven by the events which have the largest statistical significance (which are potentially events at high energies), the overall event statistics is driven by the low-energy events which have less weight in the likelihood computation. This may explain the apparent discrepancy between the event histograms and the model fit results.
#13
Updated by Knödlseder Jürgen about 3 years ago
- File sim192_above2.44TeV.png added
- File sim201_above2.44TeV.png added
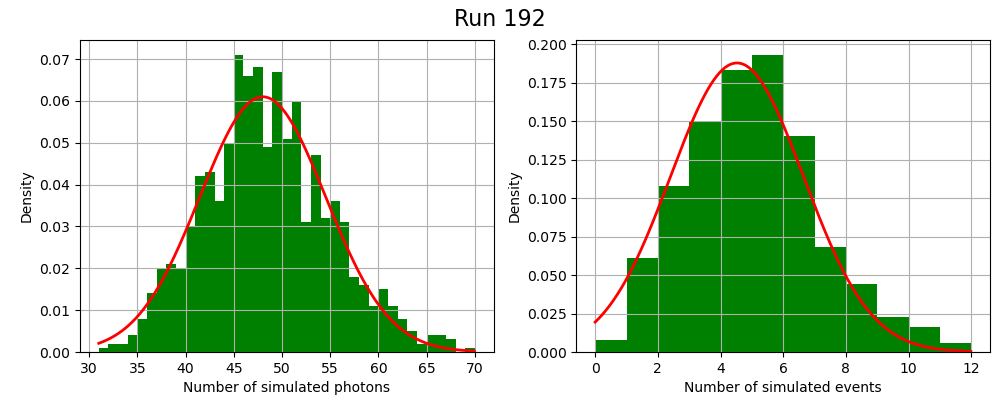
I now investigated the distribution of events with changing random number generator seed for energies above 2.44 TeV, where in run 192 2 events are simulated while in run 201 8 events are simulated. The distribution for 1000 simulations are shown in the plots below, moments of the distribution are given in the following table. While 2 events are on the left tail of the distribution, 8 events are on the right tail of the distribution. Note that for some reason, 8 out of 1000 seed values produce zero photons (seed values 81, 192, 222, 294, 465, 557, 703, and 888).
| Parameter | Run 192 value | Run 201 value |
| Mean number of photons | 47.77 | 47.69 |
| Standard deviation in number of photons | 7.49 | 7.77 |
| Mean number of events | 4.53 | 4.92 |
| Standard deviation in number of events | 2.13 | 2.26 |
 |
 |
#14
Updated by Knödlseder Jürgen about 3 years ago
- File sim192_above2.44TeV_ctools-2.0.0.dev.png added
- File sim201_above2.44TeV_ctools-2.0.0.dev.png added
Repeating the simulations for ctools-2.0.0.dev does not show the zero photon bins. The mean photon number is slightly larger, its standard deviation is slightly reduced. Not clear what the difference between ctools-1.7.0 and ctools-2.0.0.dev regarding simulations is.
| Parameter | Run 192 value | Run 201 value |
| Mean number of photons | 48.00 | 48.03 |
| Standard deviation in number of photons | 6.54 | 6.53 |
| Mean number of events | 4.53 | 4.92 |
| Standard deviation in number of events | 2.13 | 2.26 |
 |
 |
#15
Updated by Knödlseder Jürgen about 3 years ago
Below a table with the source significance in a given time bin, computed from the TS value (sqrt(TS)), the fitted normalisation (norm/error) and the number of source counts (sqrt(events)). It is a bit surprising that the first two values differ so much, I would have expected that to first order both values are similar. It is also surprising that the TS significance for run 201 is larger than the event significance, since the event significance does not account for background events, hence it formally a upper limit to the significance of the source.
| Run | Sigma(TS) | Sigma(Norm) | Sigma(events) |
| 192 | 5.9 | 3.6 | 7.3 |
| 201 | 14.5 | 7.6 | 9.3 |
#16
Updated by Knödlseder Jürgen about 3 years ago
Maybe the problem lies in the fitted flux for PWN 2059.
Below a table specifying for the first two runs the simulated number of events and the predicted number of events from the best fitting file function model. For some reason the best fitting model value for run 192 results in a predicted number of events that is about a factor of two below the level that is expected from the simulated number of events. No significant discrepancy is observed for run 201. As a reminder, the fitted normalisation of the file function is given in parenthesis with the associated statistical error.
I also did the analysis with energy dispersion enabled, which did not change the results.
Hence there are actually two effects that contribute to the low flux point for run 192:- first the number of simulated counts for run 192 is on the low side, yet the number if compliant with expectations from statistical fluctuations
- second the fitted flux is about a factor two too low, underpredicting the number of events for PWN 2059. It is this second effect that still needs to be understood.
| Run | Nsim | Npred | Npred (edisp) |
| 192 | 53 | 26.250 (0.39 ± 0.11) | 26.751 (0.39 ± 0.11) |
| 201 | 87 | 85.522 (1.16 ± 0.15) | 87.089 (1.16 ± 0.15) |
#17
Updated by Knödlseder Jürgen about 3 years ago
I now fitted the data of run 192 in the same 10 energy bins that are used internally by ctobssim for the simulations in order to investigate whether the fitted normalisation factor changes with energy. The results are summarised in the table below. Between 0.07 and 1 TeV the number of predicted events is significantly lower than the number of observed events, only at larger energies both quantities become comparable. The discrepancy increases globally with decreasing energy. I also did the analysis with energy dispersion enabled, yet this did not significantly change the results.
| Emin | Emax | Norm | Nsim | Npred | Norm (edisp) | Npred (edisp) | |
| 0.03 | 0.07 | 1.00 | 0 | 0.00 | 0 | 0.00 | |
| 0.07 | 0.17 | 0.46 ± 0.59 | 20 | 5.10 | 0.42 ± 0.54 | 5.15 | |
| 0.17 | 0.42 | 0.39 ± 0.23 | 17 | 8.66 | 0.39 ± 0.23 | 8.70 | |
| 0.42 | 1.01 | 0.34 ± 0.17 | 10 | 6.29 | 0.34 ± 0.17 | 6.29 | |
| 1.01 | 2.44 | 0.45 ± 0.22 | 4 | 4.90 | 0.45 ± 0.23 | 4.91 | |
| 2.44 | 5.89 | 0.18 ± 0.25 | 1 | 0.74 | 0.18 ± 0.25 | 0.74 | |
| 5.89 | 14.20 | 3.32 ± 3.37 | 1 | 0.99 | 3.22 ± 3.26 | 0.99 | |
| 14.20 | 34.24 | 1.00 | 0 | 0.00 | 1.00 | 0.00 | |
| 34.24 | 82.54 | 1.00 | 0 | 0.00 | 1.00 | 0.00 | |
| 82.54 | 199.00 | 1.00 | 0 | 0.00 | 1.00 | 0.00 |
I then replaced the radial disk source by a point source to check whether the issue is related to the use of a small extended source. The results are basically identical, excluding the radial disk model as the origin of the discrepancy.
| Emin | Emax | Norm | Nsim | Npred |
| 0.03 | 0.07 | 1.00 | 0 | 0.00 |
| 0.07 | 0.17 | 0.46 ± 0.59 | 20 | 5.10 |
| 0.17 | 0.42 | 0.39 ± 0.23 | 17 | 8.64 |
| 0.42 | 1.01 | 0.34 ± 0.17 | 10 | 6.28 |
| 1.01 | 2.44 | 0.45 ± 0.22 | 4 | 4.88 |
| 2.44 | 5.89 | 0.18 ± 0.25 | 1 | 0.74 |
| 5.89 | 14.20 | 3.32 ± 3.37 | 1 | 0.99 |
| 14.20 | 34.24 | 1.00 | 0 | 0.00 |
| 34.24 | 82.54 | 1.00 | 0 | 0.00 |
| 82.54 | 199.00 | 1.00 | 0 | 0.00 |
I also analysed run 201 in the same way to check the results for a “normal” run. Except for the 0.07-0.17 TeV bin, where the number of predicted events is underestimated, the number of predicted events is comparable to the number of simulated events.
| Emin | Emax | Norm | Nsim | Npred | Norm (edisp) | Npred (edisp) | |
| 0.03 | 0.07 | 1.00 | 0 | 0.00 | 0 | 0.00 | |
| 0.07 | 0.17 | 0.66 ± 0.59 | 17 | 8.58 | 0.59 ± 0.54 | 8.34 | |
| 0.17 | 0.42 | 1.57 ± 0.32 | 34 | 38.83 | 1.57 ± 0.32 | 39.19 | |
| 0.42 | 1.01 | 0.79 ± 0.22 | 15 | 15.59 | 0.78 ± 0.22 | 15.60 | |
| 1.01 | 2.44 | 1.16 ± 0.33 | 13 | 13.47 | 1.16 ± 0.33 | 13.47 | |
| 2.44 | 5.89 | 1.77 ± 0.65 | 8 | 7.73 | 1.77 ± 0.65 | 7.73 | |
| 5.89 | 14.20 | 1.00 | 0 | 0.31 | 1.00 | 0.32 | |
| 14.20 | 34.24 | 0.00 | 0 | 0.00 | 0.00 | 0.00 | |
| 34.24 | 82.54 | 1.00 0.00 | 0 | 0.00 | 1.00 | 0.00 | |
| 82.54 | 199.00 | 1.00 | 0 | 0.00 | 1.00 | 0.00 |
#18
Updated by Knödlseder Jürgen about 3 years ago
- File skymap-nopwn.png added
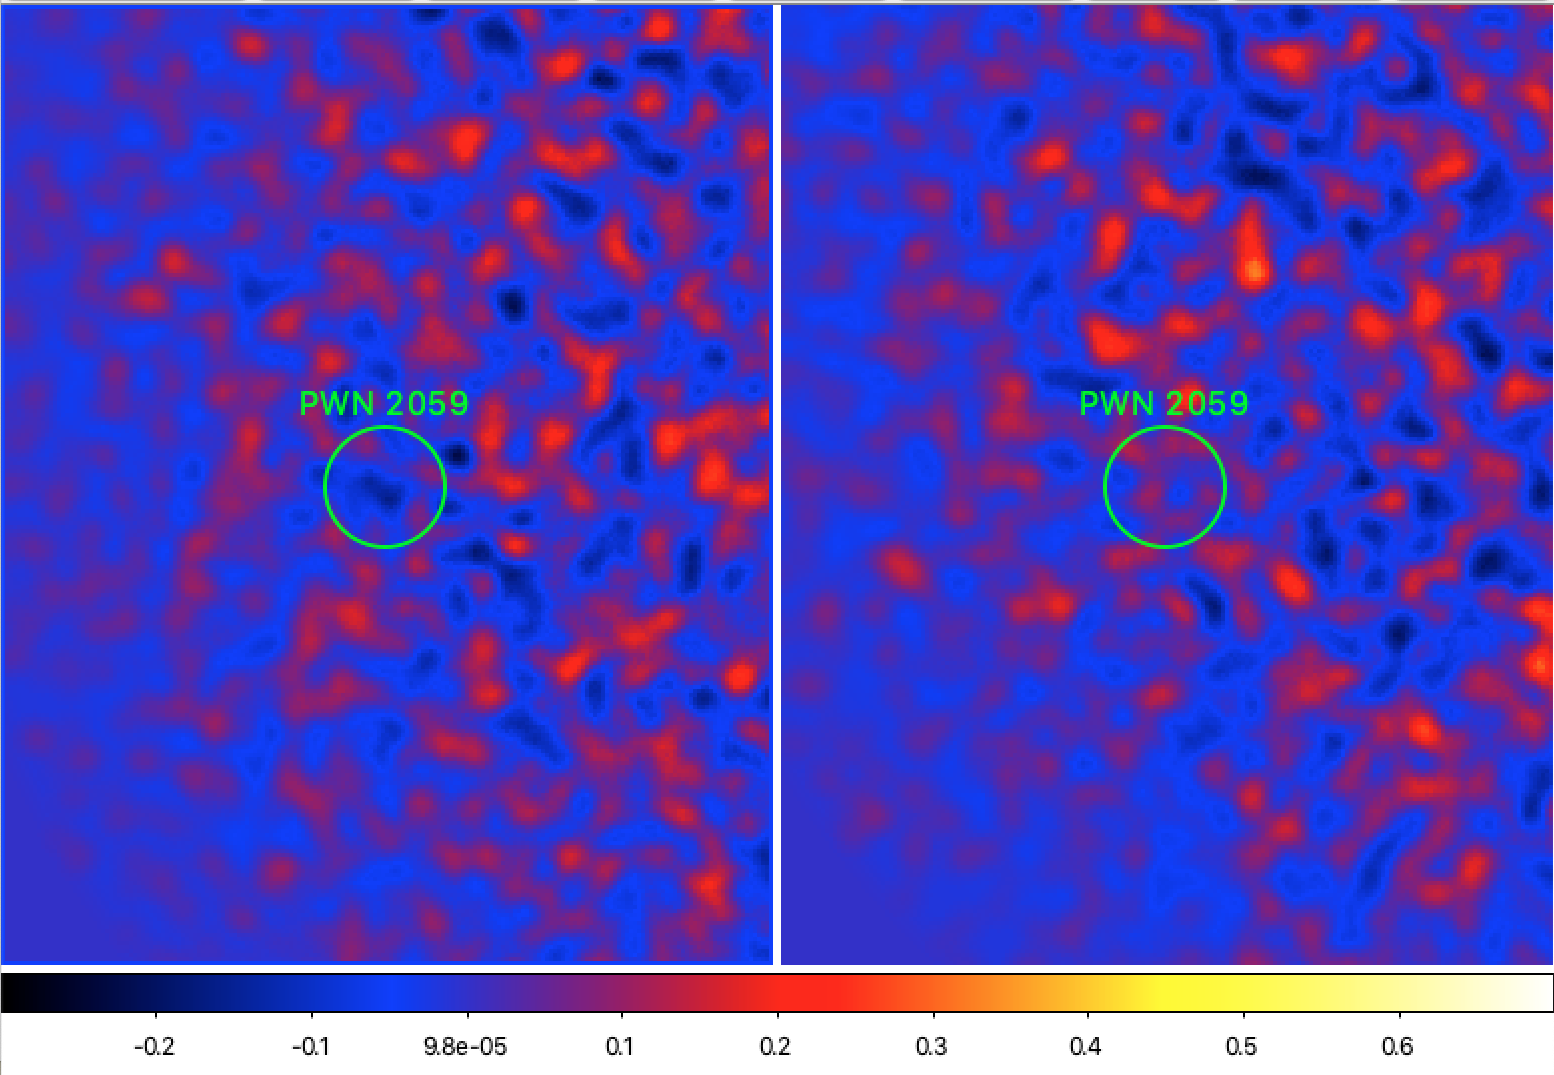
I now removed the PWN 2059 events from the simulated events for run 192 and 201 using ctselect with the parameter expr="MC_ID!=1242". This reveals the background underlying the source events. Sky maps using the selected events are shown in the panels below, left is for run 192, right is for run 201. Apparently, there is a lack of background events for run 192 in the region of PWN 2059 which may explain why the fitted flux is so low.

#19
Updated by Knödlseder Jürgen about 3 years ago
- % Done changed from 50 to 60
Unfortunately fitting of sources with negative flux does not work (probably due to internal positivity constraints), hence I could not determine the flux level to which the background hole corresponds.
#20
Updated by Knödlseder Jürgen about 3 years ago
- Status changed from In Progress to Feedback
- % Done changed from 60 to 90
- no anomaly was detected, the data are as expected based on statistics
- the number of simulated events for run 192 is on the low side, but this number is compatible with expectations from statistical fluctuations
- there is a negative background fluctuation underlying PWN 2059 that reduces the number of events attributed to the source
So the low flux point is produced by a coincidence between a small number of events simulated for PWN 2059 and a hole in the background at the location of PWN 2059 for run 192. Looks like the low flux point is really just bad luck!
#21
Updated by Knödlseder Jürgen almost 3 years ago
- Status changed from Feedback to Closed
- % Done changed from 90 to 100