Updated over 10 years ago by 
Benchmarks
This page summarizes ctools benchmarks that may give the user some guidance on how to organize his science analysis.
Single point source analysis
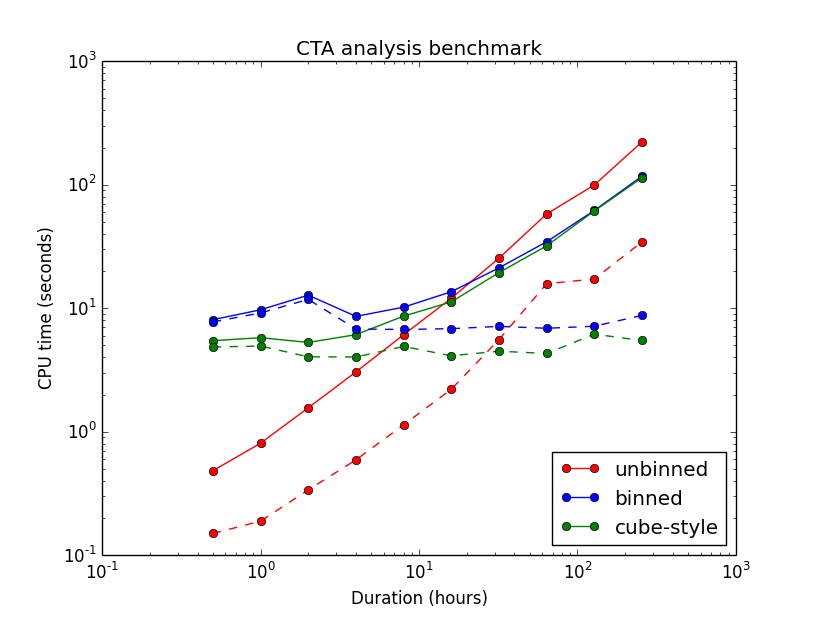
The following benchmark has been performed using the benchmark_cta_analysis.py script in the ctools examples folder. The script compares the CPU time need for executing an unbinned, a binned and a cube-style analysis pipeline, comprising event simulation, event selection or binning, exposure and PSF cube preparation for cube-style analysis, and maximum likelihood fitting. A single CTA pointing has been considered with a total observation duration that varied between 0.5 and 256 hours. The model comprised the Crab as the only point source on top of a radial acceptance background model. Free parameters were the Prefactor and spectral index of the Crab spectrum, as well as the sigma parameter and the Prefactor and spectral index of the background model. For binned and cube-style analysis, a cube of 200x200x20 bins was used with a spatial binning of 0.02 deg. The energy range for all analyses covered 0.1-100 TeV.
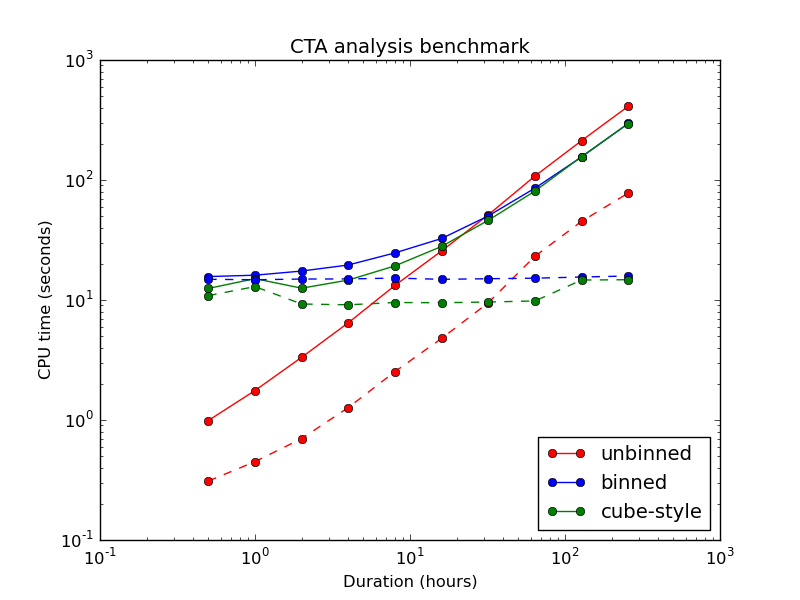
Results are shown below. The left plot has been obtained on a MacBook Pro (2.66 GHz Intel Core i7, 4 GB, OS 10.6), the right plot on a Dell PowerEdge R815 (2.20 GHz AMD Opteron 6174 12 core, 256 GB, CentOS 5). Analysis on the MacBook Pro is substantially faster than the analysis on the Dell PowerEdge. The solid lines show the total CPU time spent for the analysis, the dashed lines show the time spent for the ctlike run. Overall, cube-style analysis is somewhat faster than the original binned analysis (the difference being that cube-style uses exposure and PSF cubes for response computation, while the original binned analysis accesses the instrumental response functions). Unbinned is faster than binned or cube-style for durations shorter than 20-30 hours. The CPU time spent in binned and cube-style ctlike runs is independent of the observation duration. However, CPU time spent for event simulation and analysis preparation increases with observation duration.
 |
 |